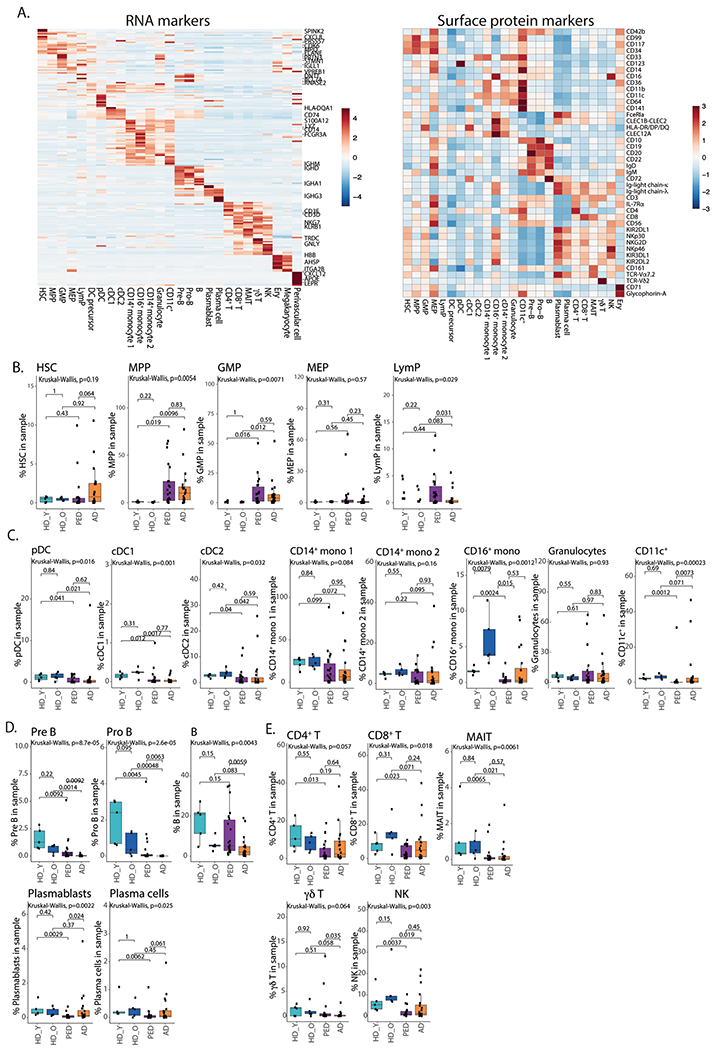
Extended Data Fig. 1 |. Cell populations in the bone marrow.

a. Heatmap of average expression of top RNA cluster markers for different cell subsets in the BM (left), heatmap of average expression of surface protein markers for different cell subsets in the BM (right). HSC – hematopoietic stem cells, MPP – multipotent progenitors, GMP – granulocyte-monocyte progenitors, MEP – megakaryocyte progenitors, LymP – lymphoid progenitors, DC – dendritic cells, Ery – erythrocytes. b. Quantification of HSPC subsets in the BM. Box plots represent the median with the box bounding the interquartile range (IQR) and whiskers showing the most extreme points within 1.5 × IQR. c. Quantification of myeloid subsets in the BM. Box plots represent the median with the box bounding the interquartile range (IQR) and whiskers showing the most extreme points within 1.5 × IQR. d. Quantification of B cell subsets in the BM. e. Quantification of conventional (CD4+, CD8+), non-conventional (MAIT, γδ) and NK cells in the BM. Box plots represent the median with the box bounding the interquartile range (IQR) and whiskers showing the most extreme points within 1.5× IQR. All statistical tests shown in this figure are two-sided. Pair-wise comparisons were evaluated using Wilcoxon test, multi-group comparisons were evaluated using Kruskal-Wallis test. For panels B-E, HD_Y – Healthy donors 19-26 years old (n = 5), HD_O – healthy donors 39-55 years old (n = 5), PED – pediatric patients with AML (n = 22), AD – adult AML patients (n = 20).
