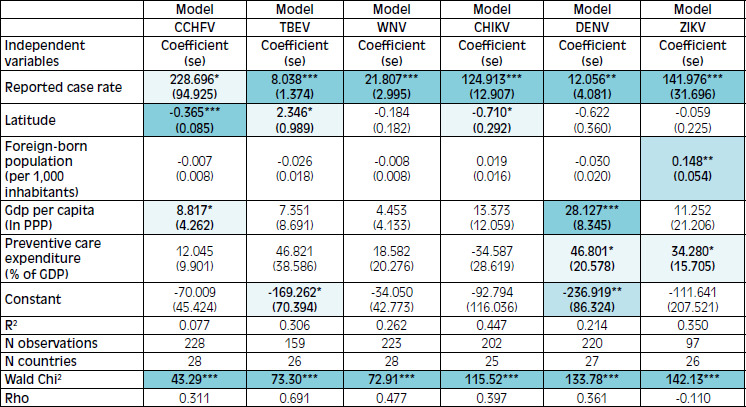
Tab. II.
Determinants of public interest in emerging arboviral diseases in Europe.

|
Models are estimated by a Prais-Winsten regression with correlated panel-corrected standard errors and a first-order auto-regressive error process. *** p ≤ 0.001; ** p ≤ 0.01; * p ≤ 0.05 (two-tailed tests). Coefficients with significant p-values are shown in light blue, with darker shades representing higher significance. Standard errors (se) are shown in parentheses below the coefficients.
