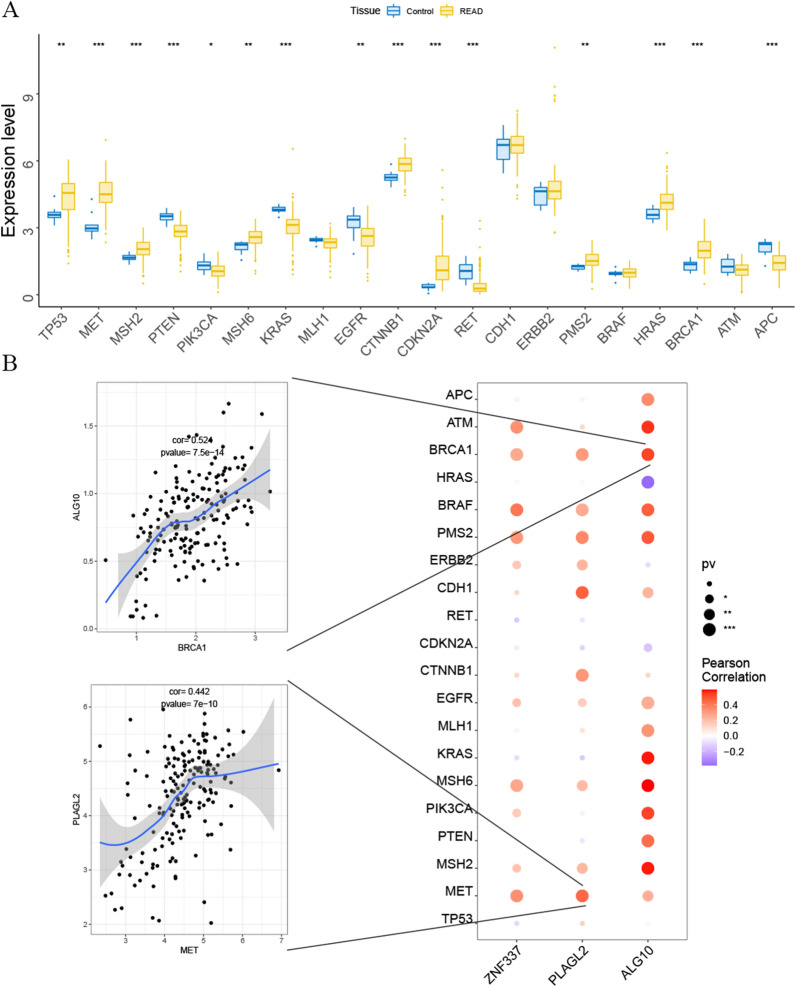
Fig. 4.
The relationship of hub genes and the disease-related genes (* represented P < 0.05, ** represented P < 0.01 and *** represented P < 0.001). A The comparisons of the expression of multiple disease-related genes between the control and READ patients. B Bubble map for the pearson correlations between three hub genes (ALG 10, PLAGL2 and ZNF337) and disease-related genes. (The bigger the circle, the closer the P - value was to zero; The redder the color, the stronger the positive correlation; The deeper of the purple color, the stronger the negative correlation)

