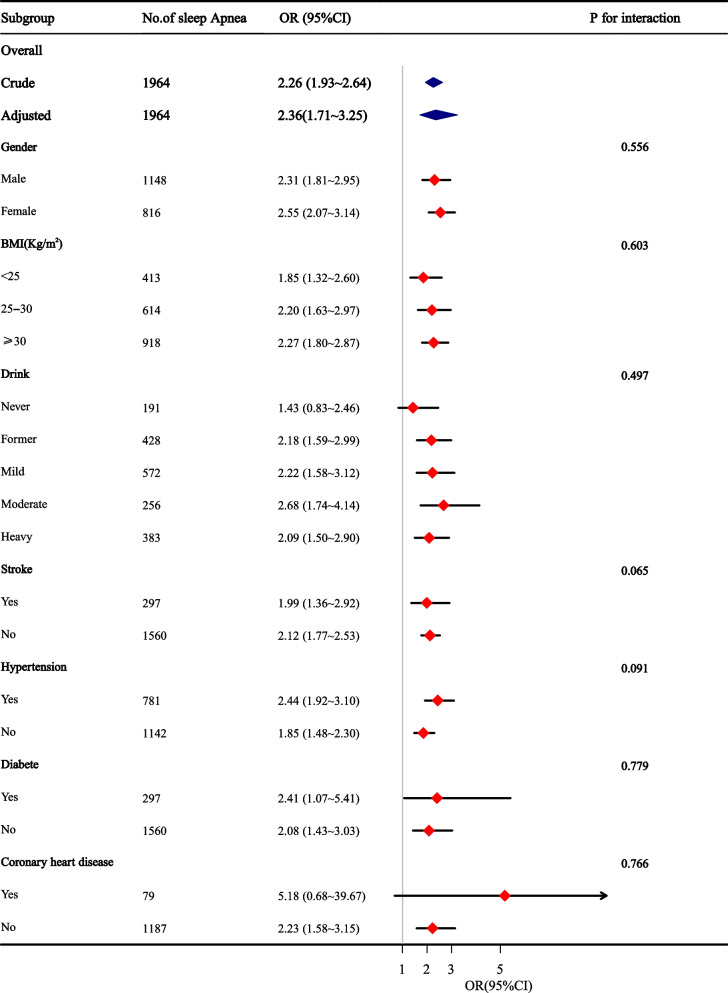
Fig. 2.
Stratified analyses assessing the effect of sleep apnea on incident depressive symptoms. Results are presented as adjusted ORs (95% CI) of sleep apnea, which were adjusted for age, sex, race, BMI, sleep duration, smoking and drinking, high-density lipoprotein cholesterol, triglyceride, and low-density lipoprotein cholesterol content (except for the variable used for stratification). CI, confidence interval, OR, odd ratio, BMI, body mass index

