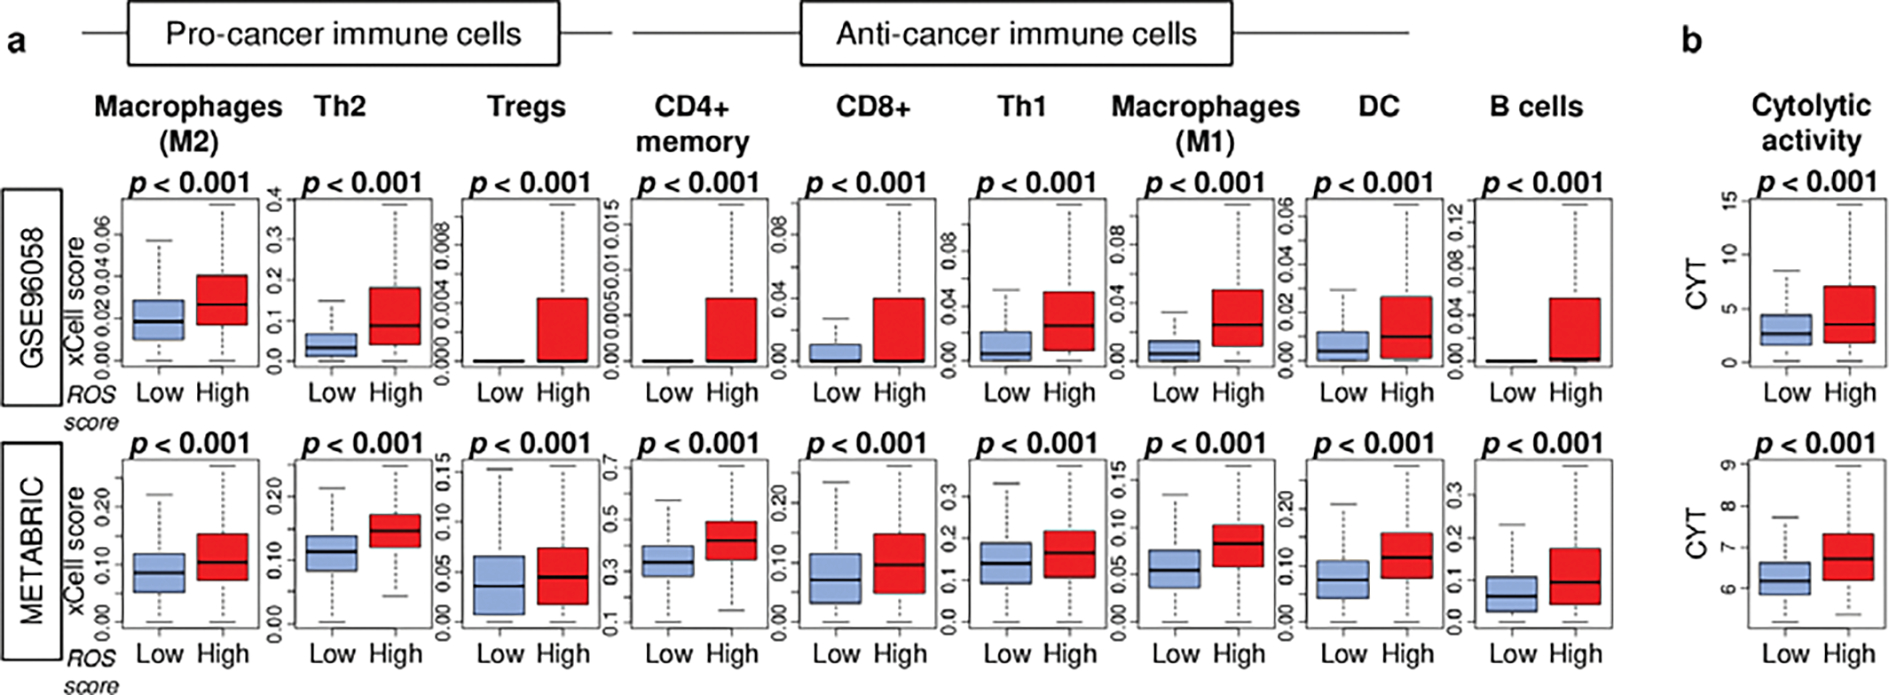
Fig. 3. Infiltrating immune cells by the ROS score in breast cancer.

Boxplots of infiltrating fraction of a. pro-cancer immune cells; regulatory T cells (Tregs), type2 T (Th2) cells, M2 macrophages, and anti-cancer immune cells; CD4+ memory T cells, CD8+ T cells, type1 T helper (Th1) cells, M1 macrophages, and B cells by high and low ROS score groups in the GSE96058 and METABRIC cohorts. b. Box plots of cytolytic activity score (CYT) by low and high ROS score groups in both cohorts. The median value was used as a cut-off to divide two score groups. P-values were calculated by the Mann-Whitney U test
