
Figure 41.
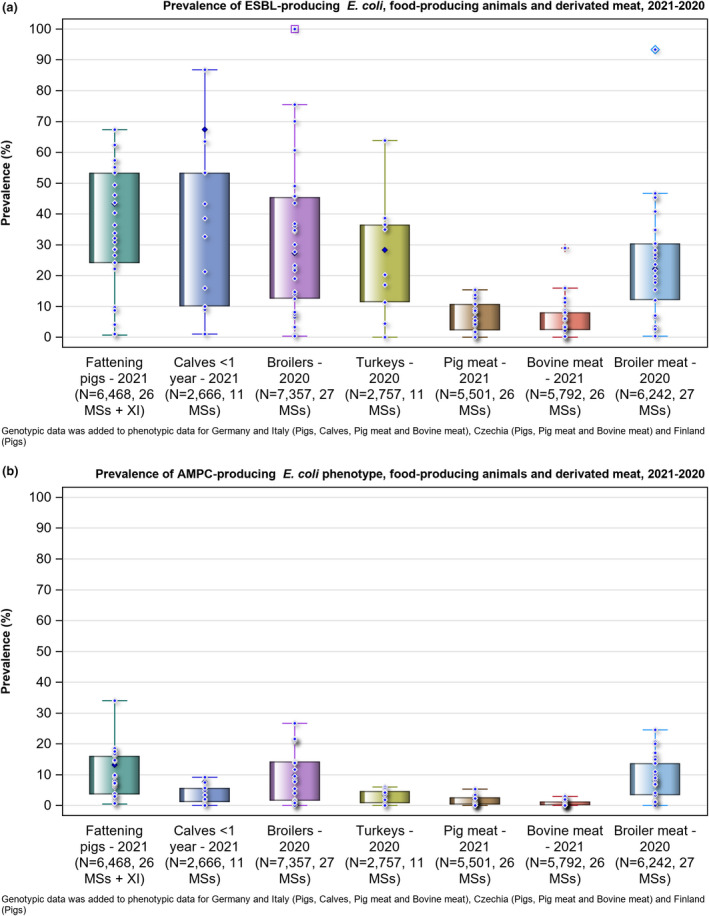
Prevalence of presumptive ESBL‐producing (a) and AmpC‐producing (b) E. coli from the specific monitoring of ESBL/AmpC‐producing E. coli, 2020/2021
- N: number of samples tested; Diamond with white outline is the data (one data point per country); Diamond with black outline is Total EU. Outliers (> 1.5 IQR from 75th percentile) are spotted using a different symbol for each matrix (for example square for Pig meat 2021)