
Figure 49.
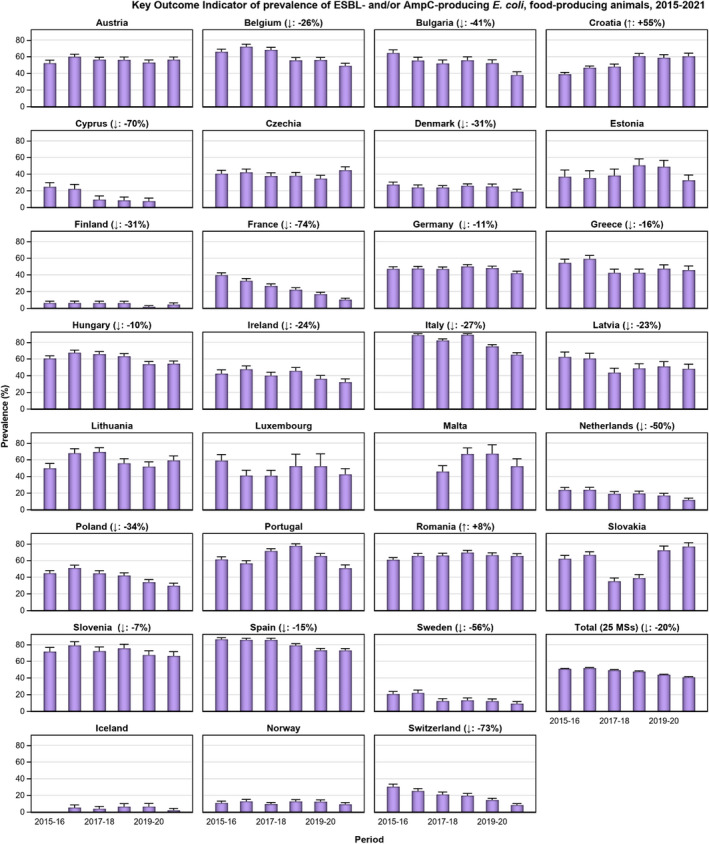
Changes in outcome indicator of ESBL‐ and/or AmpC producing E. coli (OIESC), 27 EU MSs and 4 non‐MSs, 2014–2021
-
(↓)/(↑): indicates statistically significant decreasing/increasing trends over the 2014–2021 period.Rates of change are shown for the statistically significant decreasing/increasing trends observed.