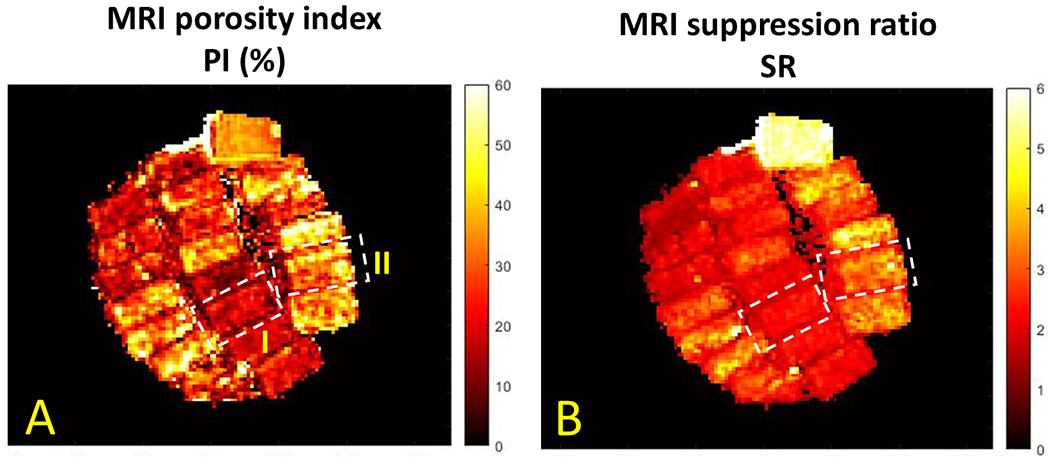
Figure 3:

(A) MRI-based porosity index (PI) and (B) suppression ratio (SR) pixel maps calculated for the twenty cortical bone strips shown in Figure 2. Specimen II (porosity of 33%, the lower sample in Figure 2D) demonstrates higher PI and SR values than specimen I (porosity of 15%, the upper sample in Figure 2D).
