Figure 5:

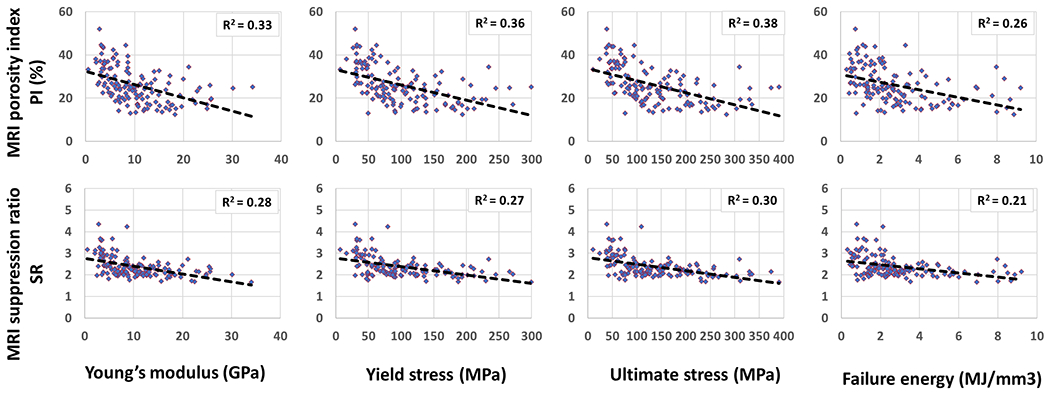
Scatterplots and linear trendlines of PI and SR versus Young’s modulus, yield stress, ultimate stress, and failure energy, respectively. R2 values were calculated from Spearman’s correlation coefficients.

Scatterplots and linear trendlines of PI and SR versus Young’s modulus, yield stress, ultimate stress, and failure energy, respectively. R2 values were calculated from Spearman’s correlation coefficients.