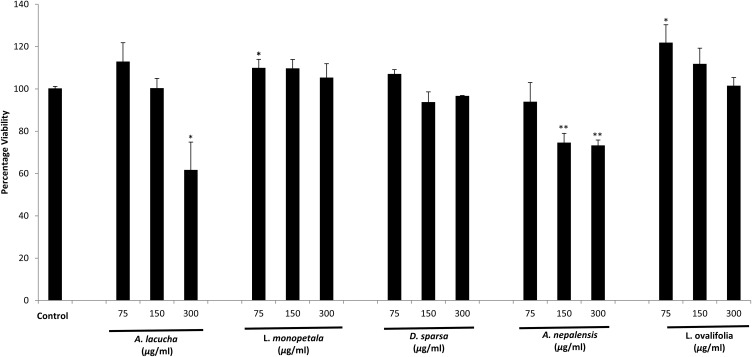
Figure 5.
Cell viability of 3T3-L1 cells on treatment with different concentrations of plant extracts. Each set of data represents the mean of triplicate experiments ± standard deviation. Significant differences between the groups were calculated using a two-tailed Student’s t-test. *p˂0.05 vs control and **p˂0.01 vs control represent significant differences in cell viability of the extract-treated group compared to the non-treated control group.

