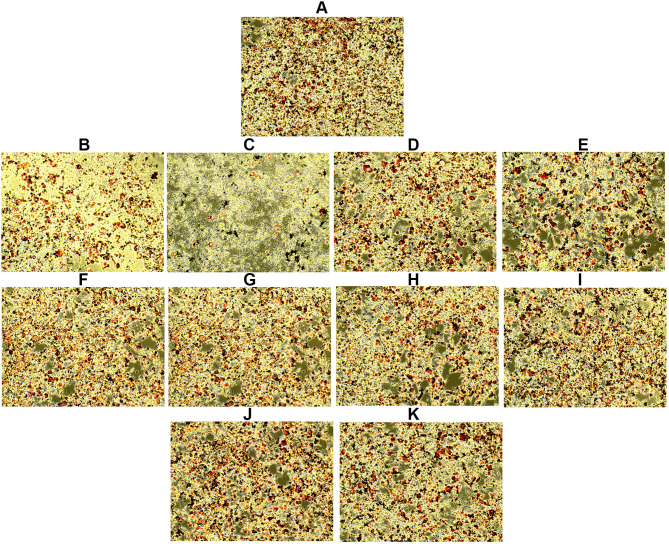
Figure 7.
Lipid accumulation in differentiated 3T3-L1 cells treated with different concentrations of extracts, as observed by an EVOS XL microscope at 10× magnification after ORO staining. (A) Control, (B) A. lacucha 50 µg/mL, (C) A. lacucha 100 µg/mL, (D) L. monopetala 50 µg/mL, (E) L. monopetala 100 µg/mL, (F) D. sparsa 50 µg/mL, (G) D. sparsa 100 µg/mL, (H) A. nepalensis 50 µg/mL, (I) A. nepalensis 100 µg/mL, (J) L. ovalifolia 50 µg/mL, and (K) L. ovalifolia 100 µg/mL. Red dots represent ORO-stained lipid droplets, and reduced density of stained droplets in extract-treated groups indicates anti-adipogenic activity of those extracts.

