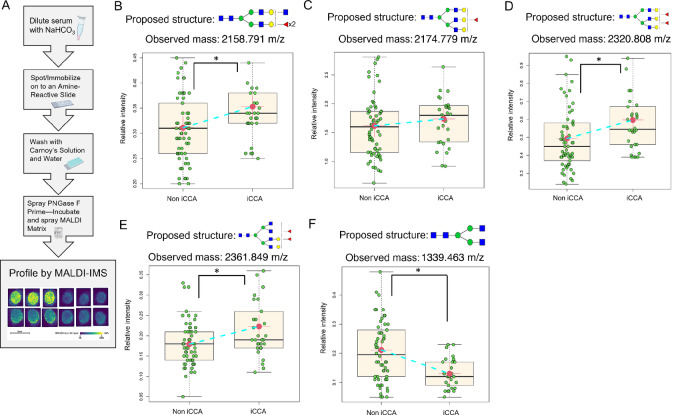
FIGURE 4.
Fucosylated N-glycans are significantly altered in iCCA serum. (A) Serum N-glycan imaging workflow. Relative intensity quantification of bisected double fucosylated N-glycan (2158.791 m/z); (B) triantennary fucosylated N-glycan (2174.779 m/z); (C) triantennary double fucosylated N-glycan (2320.808 m/z); (D) and tetraantennary double fucosylated N-glycan (2361.849 m/z); (E) biantennary N-glycan (1339.463 m/z); (F) Each point in box plots represents a patient. The asterisk indicates statistical difference (Mann–Whitney, P < 0.001) and error bars represent the SD. Non iCCA n = 62 and iCCA n = 30. The mass defect used for each m/z value is based on TMA 1 run. For N-glycans, red triangle, fucose; blue square, N-acetylglucosamine; green circles, mannose; yellow circles, galactose.

