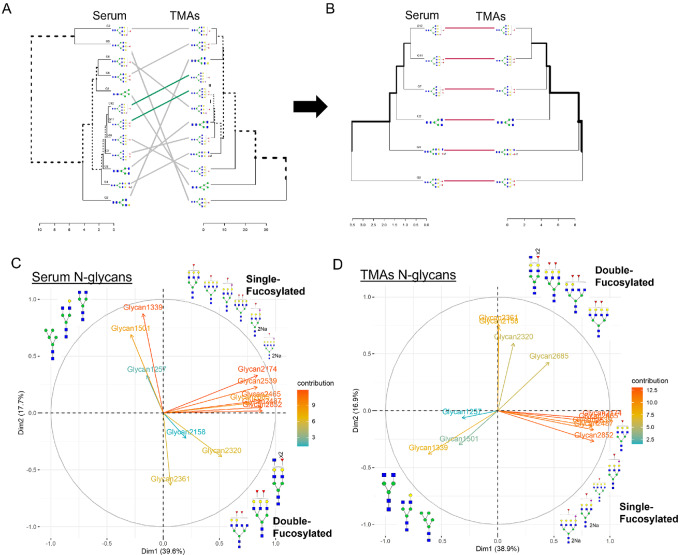
FIGURE 5.
Profile data clustering reveals N-glycan grouping based on the number of fucose residues in iCCA serum and tissue. Dendrograms representing clustering for 12 N-glycans (A) and 6 N-glycans (B) in serum and TMAs. Glycan (G), G1: 1217, G2: 1339, G3:1501, G4:2158, G5:2174, G6:2320, G7:2631, G8:2465, G9:2487, G10:2539, G11:2685, G12:2852. PCA and their dimension (Dim) of serum (C) and TMAs (D) showing N-glycan clustering based on the number of fucose residues. 2Na (doubly sodiated N-glycan). For N-glycans, red triangle, fucose; blue square, N-acetylglucosamine; green circles, mannose; yellow circles, galactose.

