
TABLE 1.
Identified N-glycans with the same trend between TMA and serum
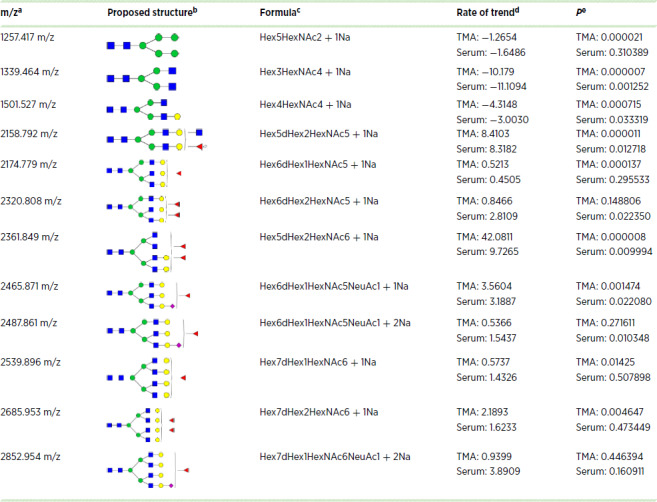
NOTE: For N-glycans, red triangle, fucose; blue square, N-acetylglucosamine; green circles, mannose; yellow circles, galactose.
Abbreviation: TMA, tissue microarray.
aObserved mass-to-charge ratio (m/z) value.
bThe proposed glycan structure based upon the m/z value.
cComposition of the identified m/z value.
dRate of trend in TMA and serum datasets.
eThe P value in TMA and serum datasets.