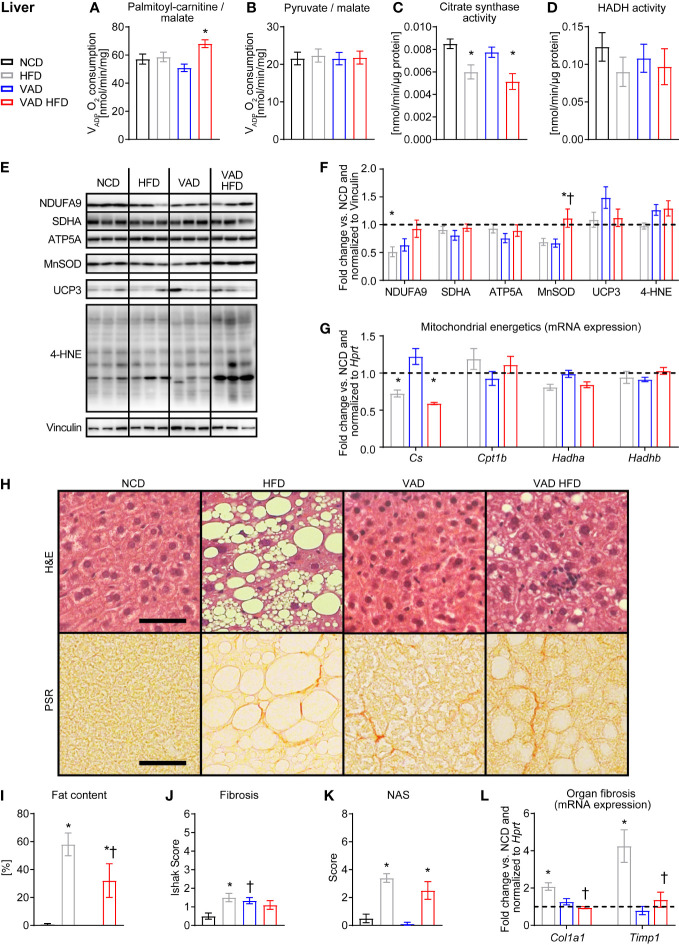
Figure 2.
VitA modulates steatosis and fibrosis in liver tissue in DIO independent of mitochondrial function. Data are reported as mean values ± SE. Two-way ANOVA was performed to analyze differences by HFD feeding and VitA. Results of post-hoc analyses for each comparison are summarized by symbols as defined: # p<0.05 for HFD feeding, $ p<0.05 for VitA, and & p<0.05 for the interaction between HFD feeding and VitA. VADP of isolated liver mitochondria with (A) palmitoyl-carnitine (#, &) and (B) pyruvate each combined with malate as substrates (n=7-8). (C) Citrate synthase (#) and (D) HADH activity in liver tissue (n=6-8). (E) Representative immunoblots and (F) densitometric analysis of NDUFA9 (&), SDHA, ATP5A, MnSOD (&),UCP3, and 4-HNE ($) normalized to Vinculin. Data are presented as fold change relative to NCD (assigned as 1.0; dashed line), n=6. (G) mRNA expression of transcripts involved in mitochondrial energetics (Cs: #, &; Hadha: #). Data are presented as fold change relative to NCD and normalized to Hprt (assigned as 1.0; dashed line), n=7-8. (H) Representative H&E and PSR stains of liver sections (scale bars: 50 μm each). Quantification of (I) fat content (#), (J) fibrosis (&), and (K) NAFLD activity scores (NAS, #), n=9-10. (L) mRNA expression of transcripts involved in organ fibrosis (Col1a1: #, $, &; Timp1: #, $, &). Data are presented as fold change relative to NCD and normalized to Hprt (assigned as 1.0; dashed line), n=7-8. *p < 0.05 vs. normocaloric diet same VitA availability, † p<0.05 vs. VitA sufficiency same caloric diet.

