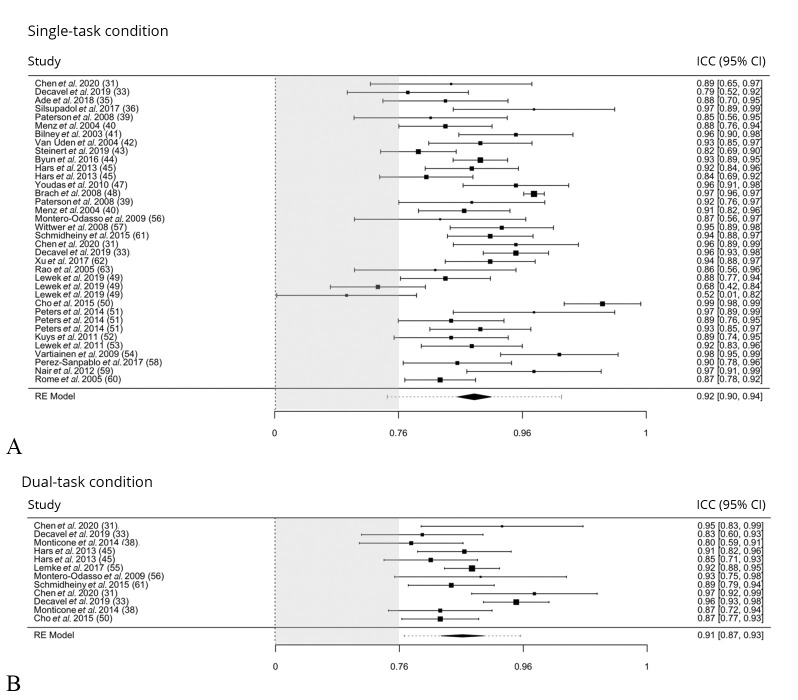
Figure 3.
—Test-retest relative reliability of gait speed. A) Results in single-task condition; and B) in dual-task condition.31, 33, 34, 36, 37, 39-45, 47-63 Forest plot displaying intraclass correlation coefficients (ICC) data (and 95% confidence interval) of the gait speed, primary outcome measure of the review. Grey box indicates the area of suboptimal ICC findings.

