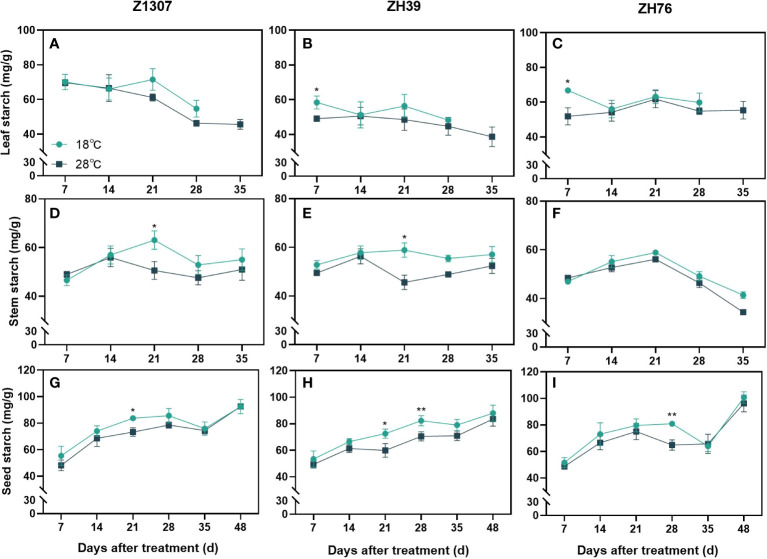
Figure 6.
Effect of high night temperature on starch content in soybean leaf, stem and seed. The light blue/ black blue line indicates the 18 ℃/28 ℃ treatment. The broken lines respect the dynamic changes of the starch content of leaf (A-C), stem (D-F) and seed (G-I) with the days of different high night temperature treatments for the three varieties of Z1307, ZH39 and ZH76. Values shown are means ± SE from three biological replicates. (*, P < 0.05; **, P < 0.01).

