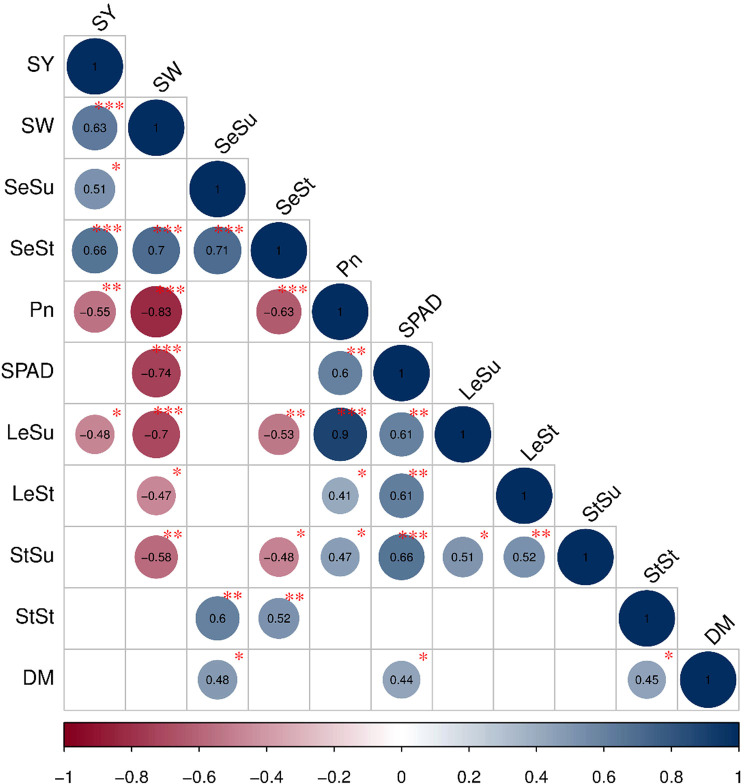
Figure 7.
Pearson correlation analysis showing the relationships between growth factors and grain yield. The circle size shows the significant level and the circle color exhibited the positive or negative correlations. P-values less than 0.001, 0.01, 0.05 are indicated by the asterisks and dot symbols: ‘* ** ’, ‘* *’ and ‘* ’.The abbreviations used in the figure are followed as: seed yield per plant (SY), seed weight (SW), seed sucrose content (SeSu), seed starch content (SeSt), photosynthetic rate (Pn), leaf sucrose content (LeSu), leaf starch content (LeSt), stem sucrose content (StSu), stem starch content (StSt), dry matter per plant (DM).

