
Figure 4.
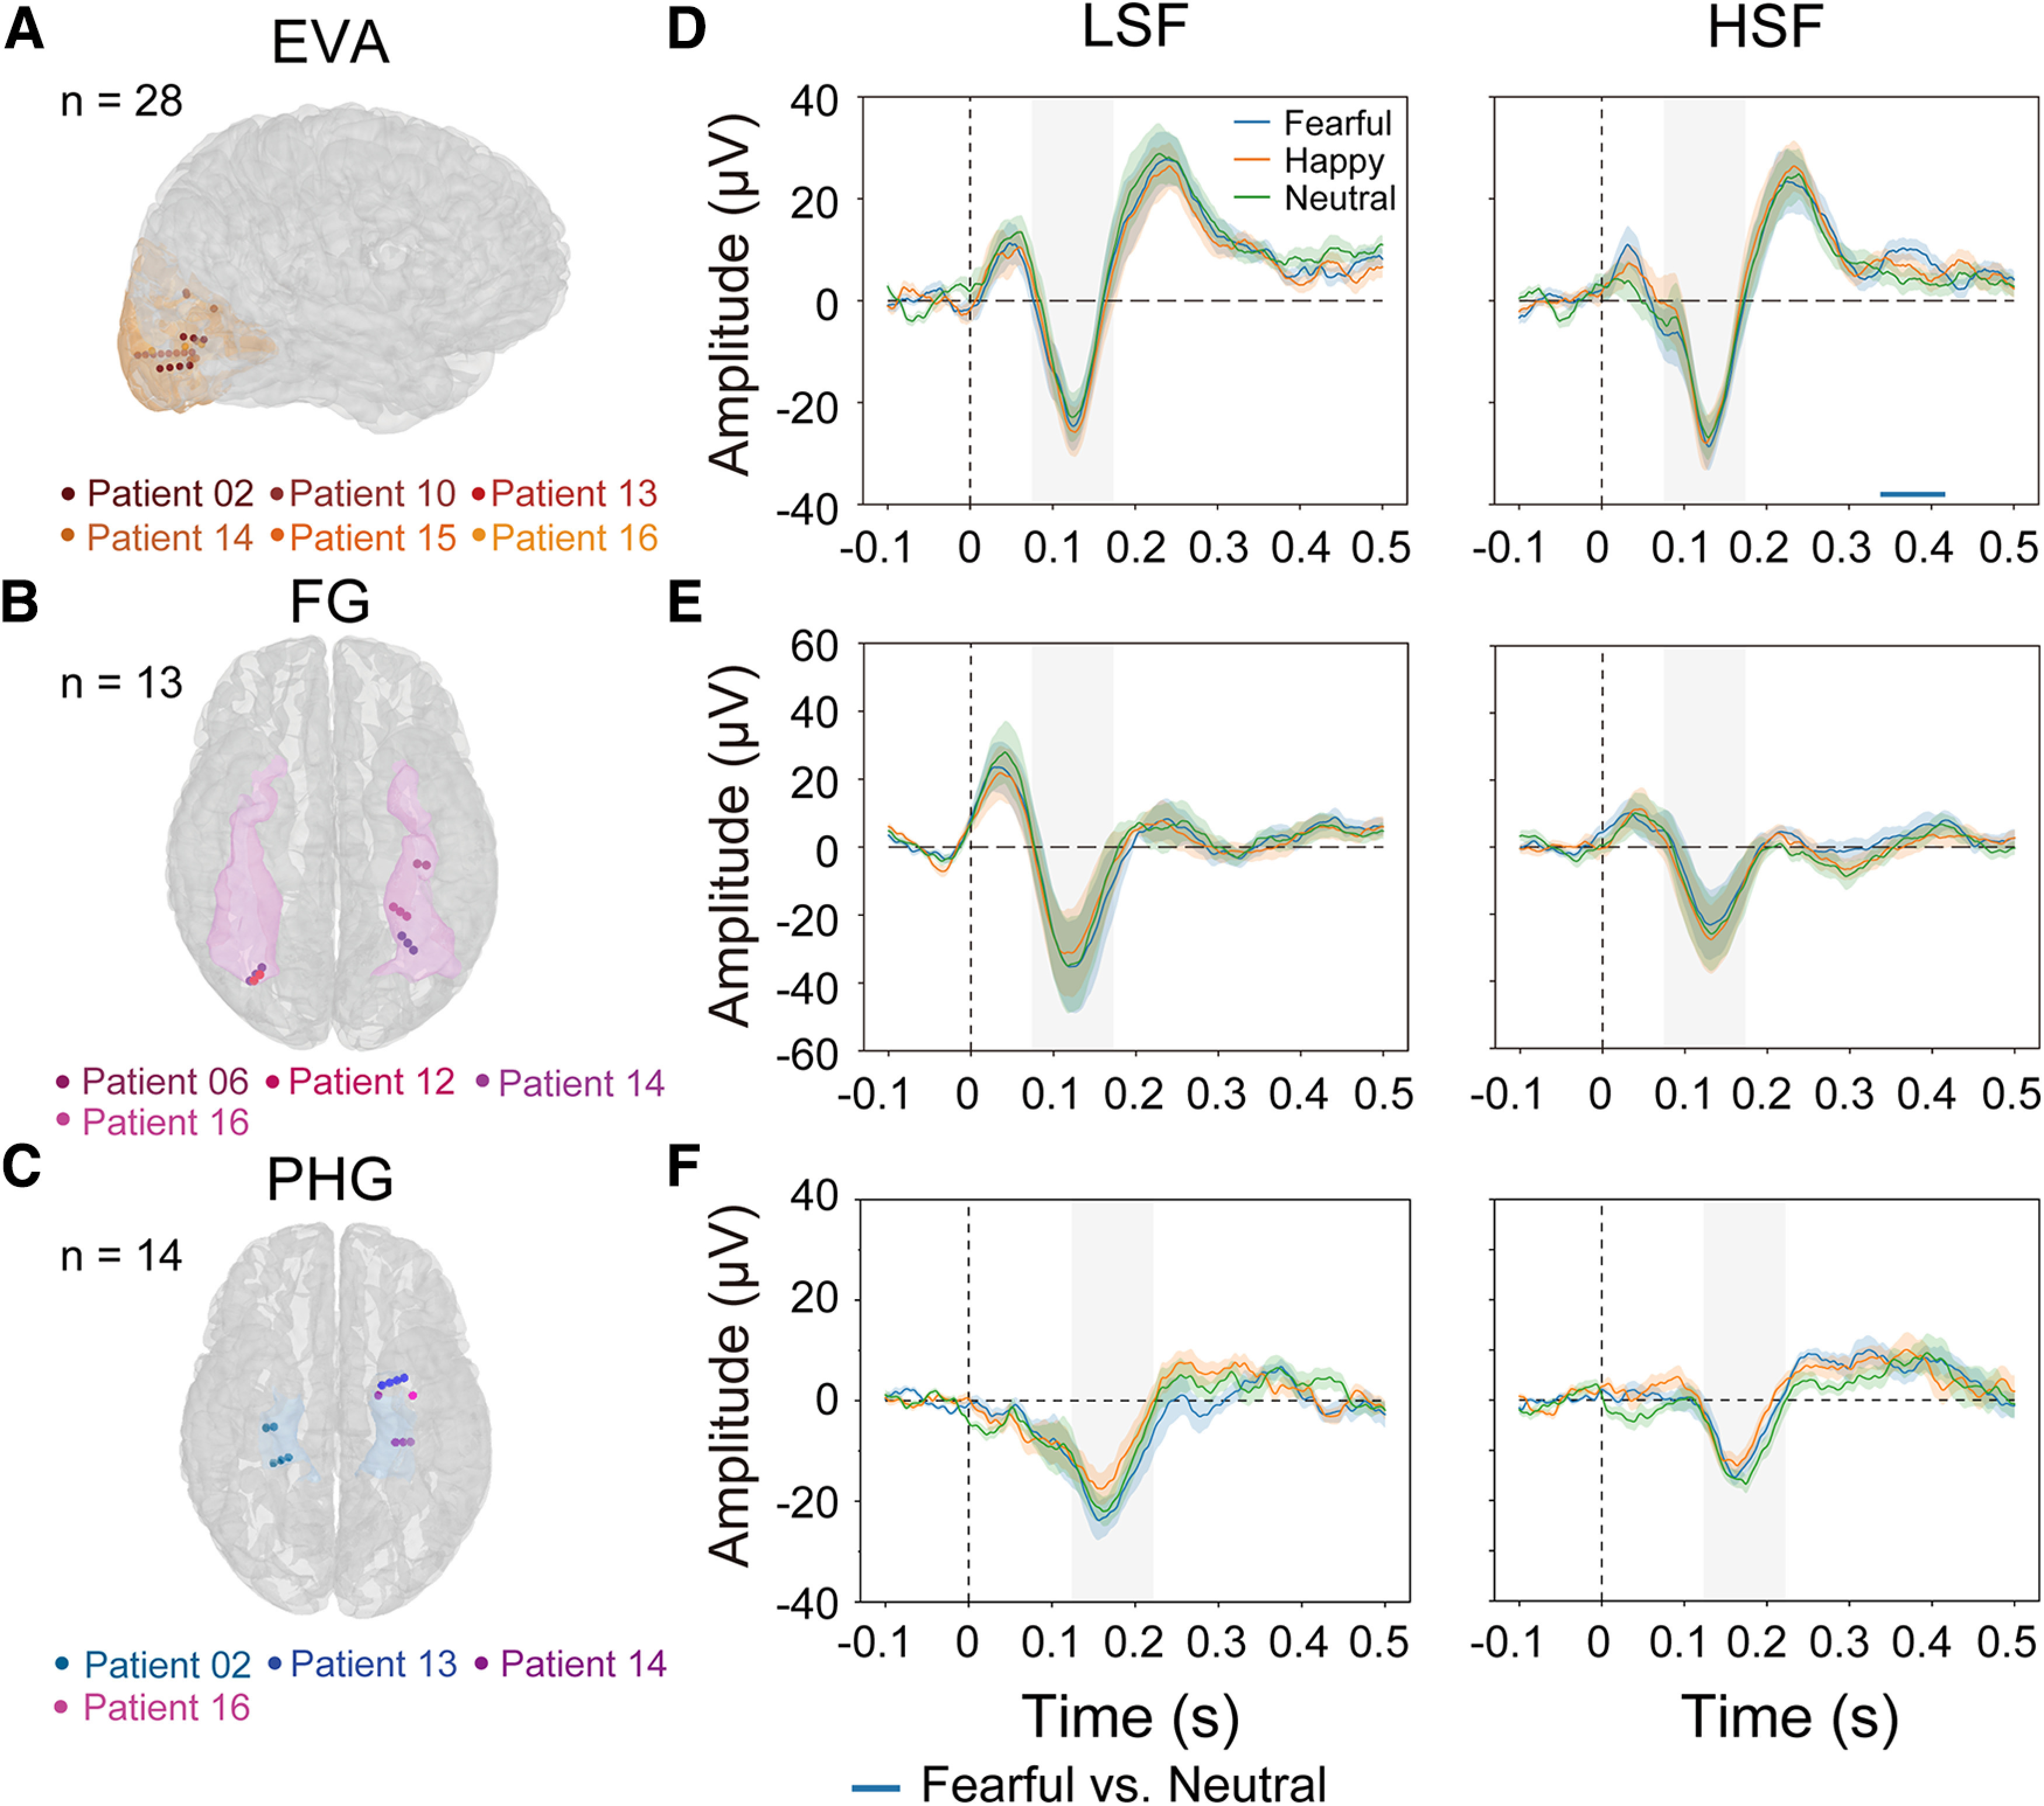
iERPs in visual cortex. A–C, Electrode contact locations in the EVAs (A), the FG (B), and the PHG (C). Contacts belonging to the same patient are depicted in the same color. D–F, iERPs to invisible fearful, happy, and neutral faces with only the LSF (left) or HSF (right) component in EVA, FG, and PHG. The horizontal bar indicates time clusters that show significant response differences between the fearful and neutral faces. The shaded areas around the iERP waveforms represent the SEM across contacts. The horizontal bar refers to the blue horizontal bar in Fig. 4D (right). The vertical shadings in D–F represent the 100-ms time window surrounding the iERP peak.