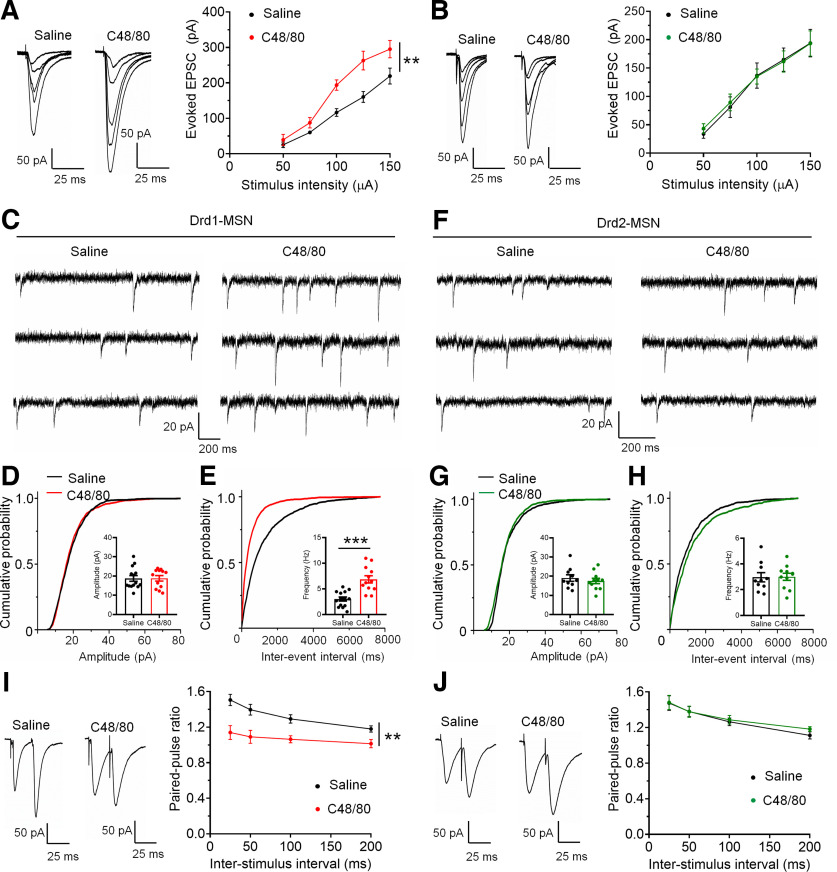
Figure 4.
C48/80 increases the efficacy of excitatory transmission onto Drd1-MSNs. A, Averaged traces and summary graph of electrical stimuli-evoked EPSCs for Drd1-MSNs from saline-treated and C48/80-treated mice in response to different stimulus intensity (n = 6 neurons/group, F(interaction 4,40) = 3.523, p = 0.0148; F(treatments 1,10) = 14.66, **p = 0.0045, two-way ANOVA with repeated measure). B, Averaged traces and summary graph of electrical stimuli-evoked EPSCs for Drd2-MSNs from saline-treated and C48/80-treated mice in response to different stimulus intensity (n = 5–7 neurons/group, F(interaction 4,40) = 0.2464, p = 0.9102; F(treatments 1,10) = 0.01156, p = 0.9165, two-way ANOVA with repeated measure). C, Representative traces of sEPSCs obtained in Drd1-MSNs of the NAc core from saline-treated and C48/80-treated mice. D, Cumulative probability of sEPSC event amplitude (K-S test, p = 0.284) for a representative Drd1-MSN. Inset, Summary bar graph and scatter plot for sEPSC amplitude in the saline-treated and C48/80-treated mice (n = 12–14 neurons/group, p = 0.8995, U = 81, Mann–Whitney U test). E, Same as D for cumulative probability of interval between sEPSC events (K-S test, p < 0.0001) and sEPSC frequency (n = 12–14 neurons/group, ***p < 0.0001, t(24) = 4.858, Student’s t test). F, Sample traces of sEPSCs obtained in Drd2-MSNs. G, Cumulative probability of sEPSC event amplitude (K-S test, p > 0.05) for Drd2-MSNs. Inset, Summary bar graph and scatter plot for sEPSC amplitude in the saline-treated and C48/80-treated mice (n = 10–11 neurons/group, p = 0.4936, t(19) = 0.698, Student’s t test). H, Same as G for cumulative probability of interval between sEPSC events (K-S test, p > 0.05) and sEPSC frequency (n = 10–11 neurons/group, p =0.9273, t(19) = 0.09241, Student’s t test). I, Averaged traces and summary graph of PPR for Drd1-MSNs from saline-treated and C48/80-treated mice at different interstimulus intervals (n = 8–9 neurons/group, F(interaction 3,45) = 3.488, p = 0.0232; F(treatments 1,15) = 14.66, **p = 0.0016, two-way ANOVA with repeated measure). J, Averaged traces and summary graph of PPR for Drd2-MSNs from saline-treated and C48/80-treated mice at different interstimulus intervals (n = 8–9 neurons/group, F(interaction 3,45) = 0.3581, p = 0.7835, F(treatments 1,15) = 0.1289, p = 0.7246, two-way ANOVA with repeated measure).

