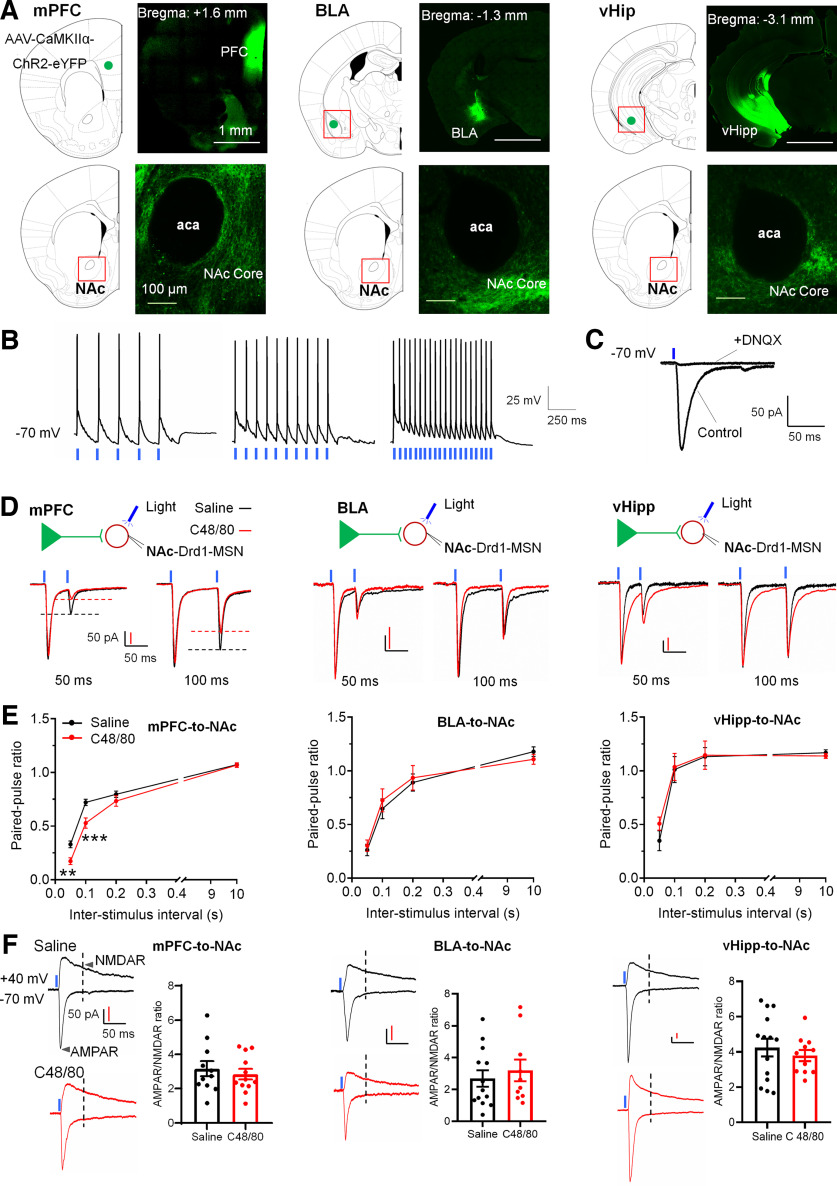
Figure 5.
C48/80 increases the projection from the mPFC to Drd1-MSNs in the NAc core. A, Representative coronal brain slices show the expression of AAV-CaMKIIα-ChR2-eYFP in the mPFC, BLA, and vHipp and ChR2-eYFP-containing terminals in the NAc core. aca, anterior commissure, anterior part. B, Representative traces of blue LED light-induced action potentials at different frequencies in ChR2-positive neurons in the mPFC. C, Blue light-induced EPSC recorded from Drd1-MSN at NAc core in the absence or presence of 20 μm of DNQX. D, Sample traces of light-evoked EPSCs for Drd1-MSN in the NAc core obtained from synapses within the mPFC-to-NAc, BLA-to-NAc, or vHipp-to-NAc pathways in saline-treated and C48/80-treated mice. EPSCs recorded at −70 mV with 50- and 100-ms interstimulus intervals. Blue lines show the onset of paired light stimulations. E, Mean PPR values of Drd1-MSNs obtained from synapses within the mPFC-to-NAc (n = 12–14 neurons), BLA-to-NAc (n = 10–13 neurons), or vHipp-to-NAc (n = 11–14 neurons) pathways at different interstimulus intervals in saline-treated and C48/80-treated mice (F(interaction 3,72) = 4.872, p = 0.0041; F(treatments 1,24) = 10.16, p = 0.0040; two-way ANOVA with repeated measure). **p < 0.01; ***p < 0.001. F, Sample traces of AMPAR-EPSCs and NMDAR-EPSCs (left panel of each group) recorded at −70 and +40 mV on Drd1-MSNs in the NAc core from the light stimulation of different synaptic inputs in saline-treated and C48/80-treated mice. Summary bar graph (right panel of each group) shows the AMPAR/NMDAR response ratios on Drd1-MSNs from the different synaptic inputs in saline-treated and C48/80-treated mice (mPFC input, n = 11–12 neurons; BLA input, n = 10–13 neurons; vHipp input, n = 11–14 neurons).

