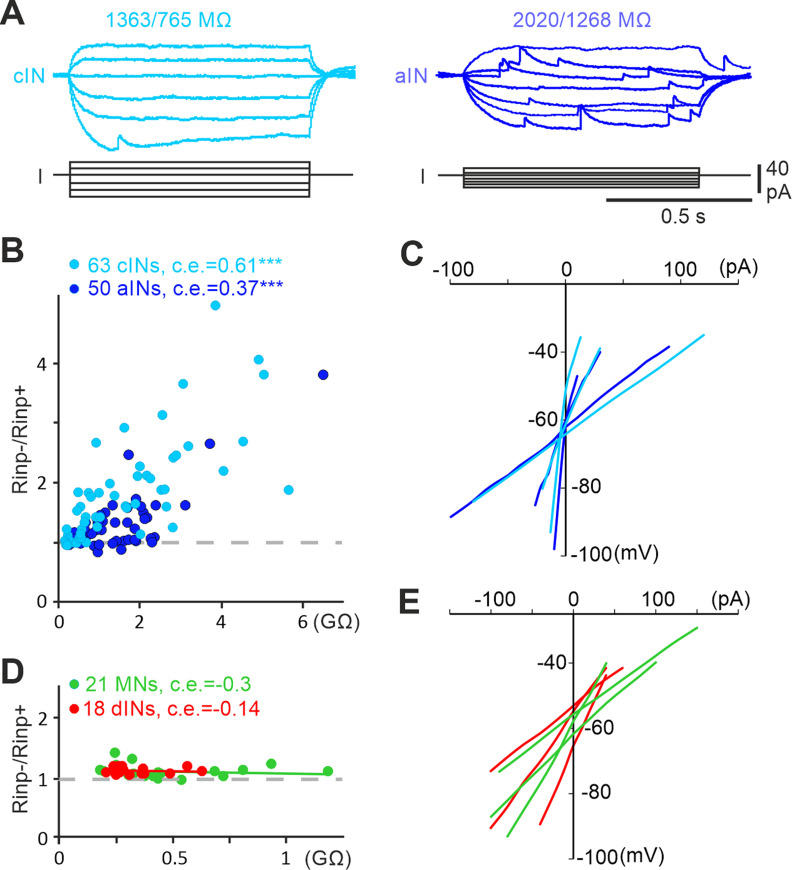
Figure 3.
Cellular input resistances of neurons active in tadpole swimming. A, I–V tests of a cIN and an aIN with rectification using step currents (Rinp−/Rinp+ on top of traces). B, Rinp−/Rinp+ plotted against Rinp−. Correlation coefficient (c.e.) and significance (*p < 0.05, ***p < 0.001) are indicated above plots. C, Example I–V curves for cINs (light blue) and aINs (dark blue) with different Rinp. D, Rinp−/Rinp+ plotted against Rinp− for MNs and dINs with little rectification. E, Their I–V curve examples (MNs, green; dINs, red). Gray dashed lines in B and D indicate Rinp−/Rinp+ of 1.

