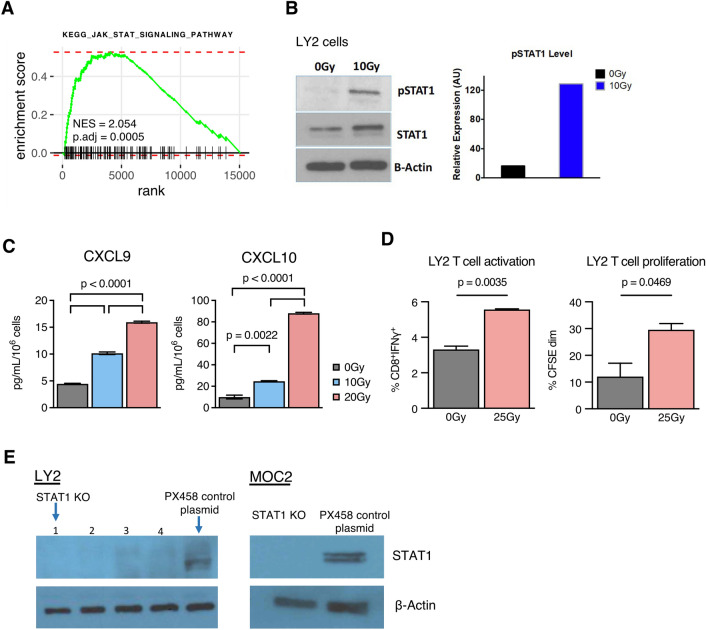
Fig. 1.
RT induces STAT1 phosphorylation, CXCL9/10 release by cancer cells, and activation and proliferation of effector T cells a Enrichment curve for KEGG_JAK_STAT_SIGNALING_PATHWAY from RNA-Seq expression data in LY2 tumors harvested 3 days post-RT (10 Gy) compared to 0 Gy controls. b Western blot quantification of STAT1, pSTAT1, and β-Actin in LY2 cancer cell line 24 h post-RT (10 Gy) versus 0 Gy controls. c CXCL9 and CXCL10 concentration in conditioned media harvested from irradiated LY2 cells 3 days post-RT (10 Gy) versus 0 Gy controls. d Characterization of CD8 T cells co-cultured with irradiated LY2 cells in the presence of IL-2: proportion of CD8 T cells expressing IFNγ and proportion showing dim CFSE signal. Comparisons shown for LY2 cells irradiated with 25 Gy dose prior to co-culture versus 0 Gy controls. e Western blot quantifications of STAT1 KO cell line clones and corresponding PX458 control cell lines

