Fig. 3.
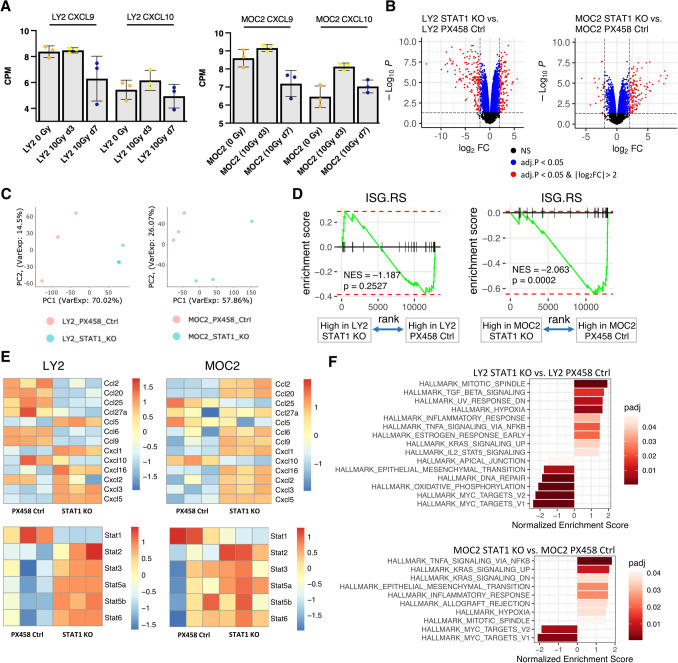
RT-induced CXCL9/10 are transiently expressed, and STAT1 KO alters the cancer-cell expressed chemokine profile a Transcriptome expression of CXCL9 and CXCL10 from tumors of LY2 and MOC2 tumor-bearing mice. b Volcano plots showing differential expression in STAT1 KO versus PX458 control cell lines. Positive log2 fold change indicates greater expression in STAT1 KO groups. Y-axis indicates the negative logarithm of BH-adjusted p-values. c Principal component analysis of STAT1 KO versus PX458 control cell lines. d Enrichment curves for interferon stimulated genes of resistance from cell line transcriptome expression, signature derived from Benci et al.[17] e Heatmaps for detected CC chemokines, CXC chemokines, CC ligands, and STAT family gene expression in STAT1 KO and PX458 control cell lines. f Waterfall plots depicting all significant Hallmark pathways for indicated comparisons for cell line transcriptome expression. Darker red colors indicate smaller p-adjusted value

