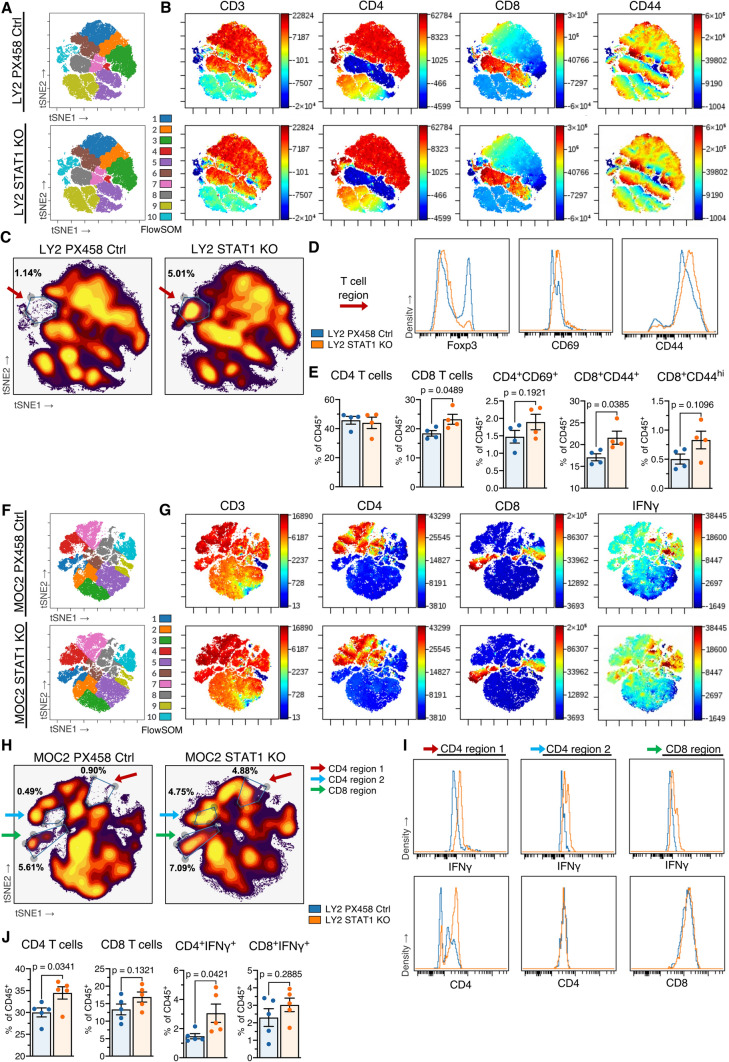
Fig. 4.
STAT1 KO tumor-bearing mice exhibit increased immune activation a tSNE plots for nodal CD45 + leukocytes from mice bearing LY2 STAT1 KO or LY2 PX458 control tumors, colored by FlowSOM predicted populations. b Expression across the nodal leukocyte landscape for CD3, CD4, CD8, and CD44. c Density plot of nodal leukocytes, with gate drawn around indicated T cell region and percent in the gate out of total CD45 + leukocytes. d Histograms depicting Foxp3, CD69, and CD44 expression of the T cell region. e Characterization of nodal CD4 and CD8 T cells as percent of CD45+ leukocytes. Unpaired two-tailed t test. f tSNE plots for nodal live CD45 + leukocytes from mice bearing MOC2 STAT1 KO or MOC2 PX458 control tumors, colored by FlowSOM predicted populations. g Expression across the nodal leukocyte landscape for CD3, CD4, CD8, and IFNγ. h Density plot of nodal leukocytes, with gates drawn around indicated CD4 and CD8 T cell regions and percent in each gate out of total live CD45 + leukocytes. i Histograms depicting IFNγ and CD4 expression of CD4 region 1, CD4 region 2, and CD8 region. j Characterization of nodal CD4 and CD8 T cells as percent of CD45+ leukocytes. Unpaired two-tailed t test

