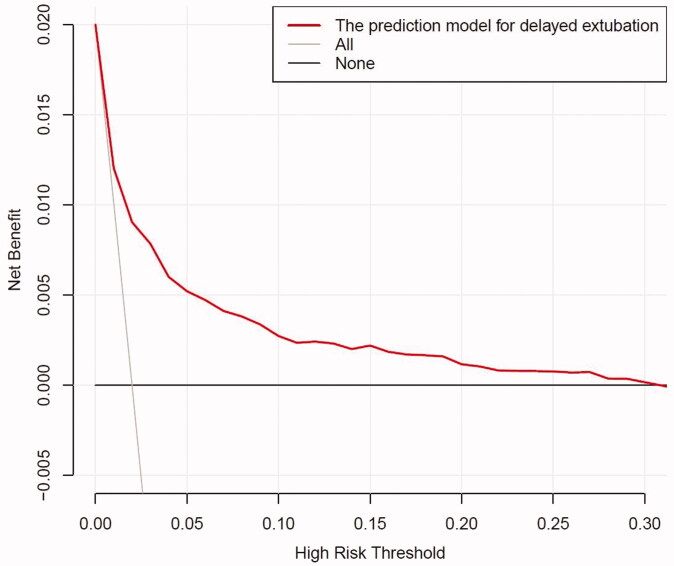
Figure 5.
The DCA shows the clinical usefulness of the nomogram. The Y-axis represents net benefit. The bold solid black line is a nomogram predicting the risk of delayed extubation. The solid grey line indicates that all patients occurred delayed extubation, while the fine solid black line indicates that no patient occurred delayed extubation. This DCA could provide a larger net benefit, with ranges of 0% to 30%. DCA: decision curve analysis .

