
Figure 10.
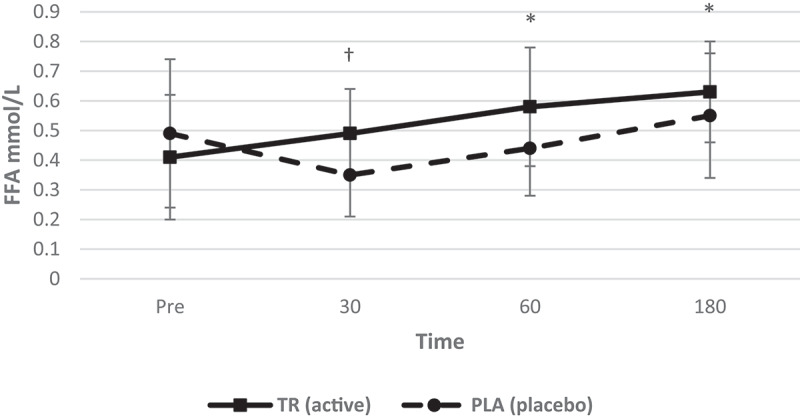
Free fatty acid concentration over time. A significant interaction (condition*time) as well as main effects for condition and time were observed. Free fatty acid levels increased at 60 and 180 min post-ingestion of TR and free fatty acid levels were greater than PLA at 30 min (condition: 1 = TR; 2 = PLA). *Denotes statistical significance at p < 0.05 for differences from baseline to each timepoint; †denotes statistical significance at p < 0.05 for differences between conditions.