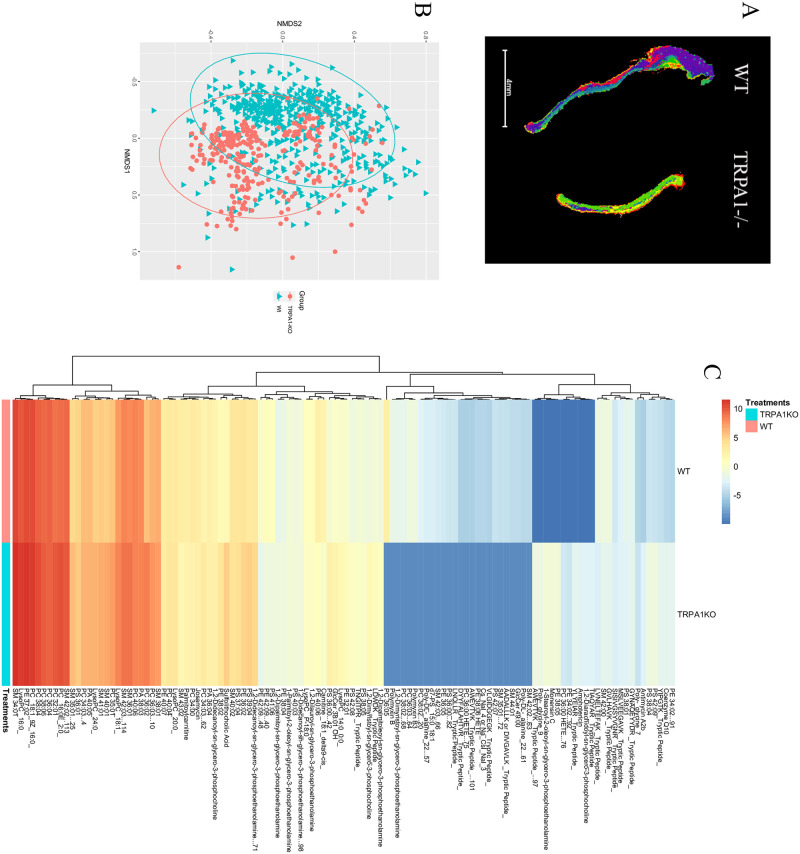
Fig 3. TRPA1-/- have differing metabolic response to TDI exposure.
Ears from mice treated with TDI as in Fig 1 were collected and examined by imagine mass spec. (A) Segmentation for representative ear, (B) NMDS similarly plot, and all of the metabolites that were identified by both m/z and collisional cross section (C) are shown. Data represent three independent experiments and calculated as NMDS (B) or ANOVA (C). WT = wild type mice.

