. 2023 Feb 6;12:e80500. doi: 10.7554/eLife.80500

Figure 2. Muscles cluster into three main groups based on cell type composition.

(A) The heatmap shows the mean eigenvalues of genes marking each cell type across all the individuals. Each row shows a muscle, and each column shows a cell type. FAP stands for fibro-adipogenic progenitors. (B) The boxplot shows the eigenvalues for the endothelial cells, fast-twitch, and slow-twitch myofibers per muscle. The boxes reflect the median and interquartile range.

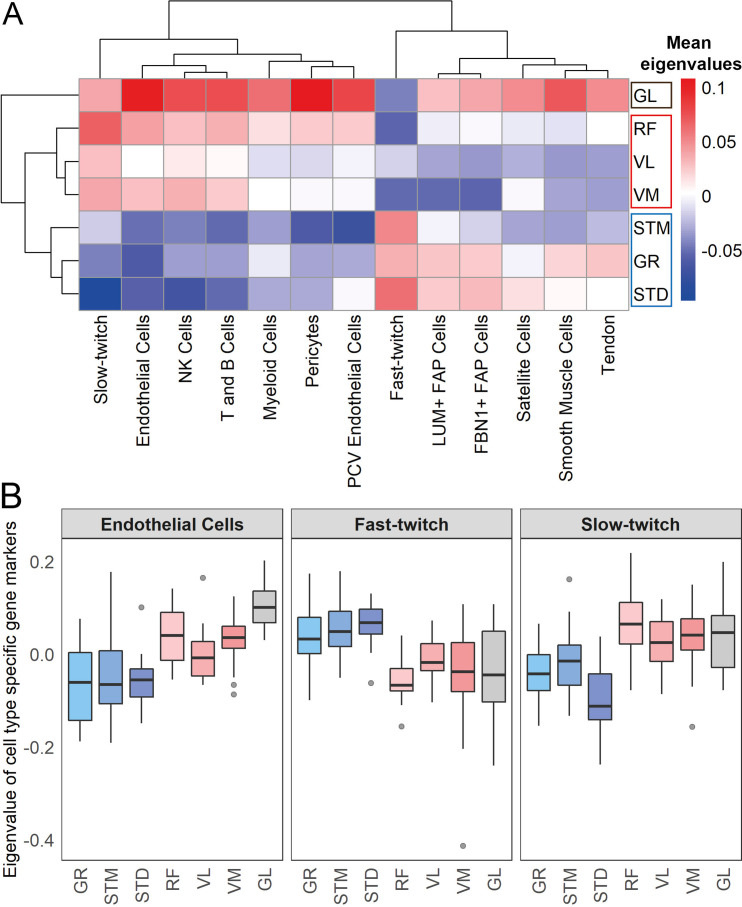
Figure 2.

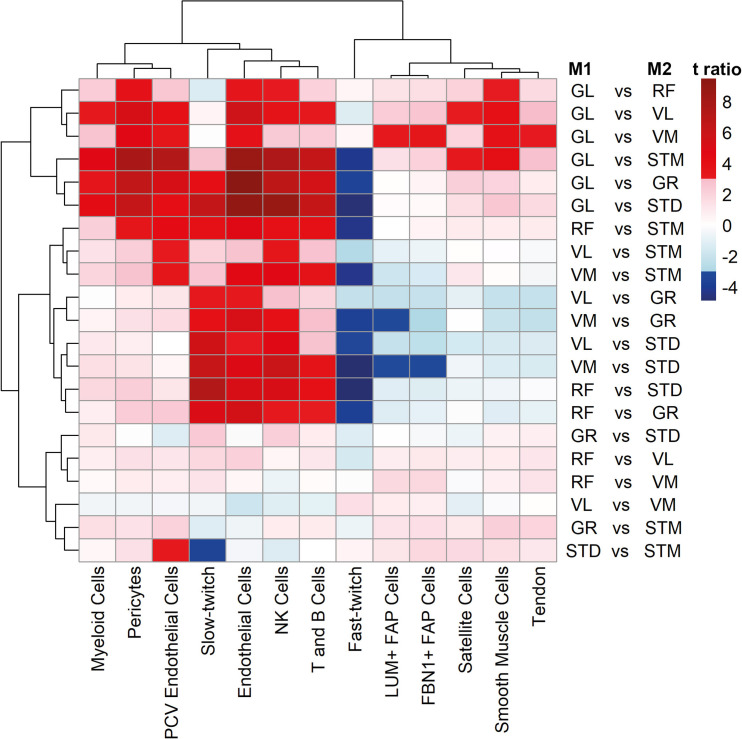
Figure 2—figure supplement 1. Cell type composition pairwise comparison between muscles.

Figure 2—figure supplement 1.

The heatmap shows the differences between each pair of muscles. The statistically significant variation between muscles was tested by ANOVA followed by the post-hoc pairwise comparisons. Each row corresponds to a pairwise comparison, and each column shows a cell type. Color-coded cells show the corresponding t-ratio for the differences in eigenvalue of a cell type in each pairwise comparison. The significant differences (Tukey p-value <0.05) are colored red (significantly higher eigenvalues in muscle M1) or blue (significantly higher eigenvalues in muscle M2). The non-significant differences are colored from pink (relatively higher eigenvalues in M1) to light blue (relatively higher eigenvalues in M1).
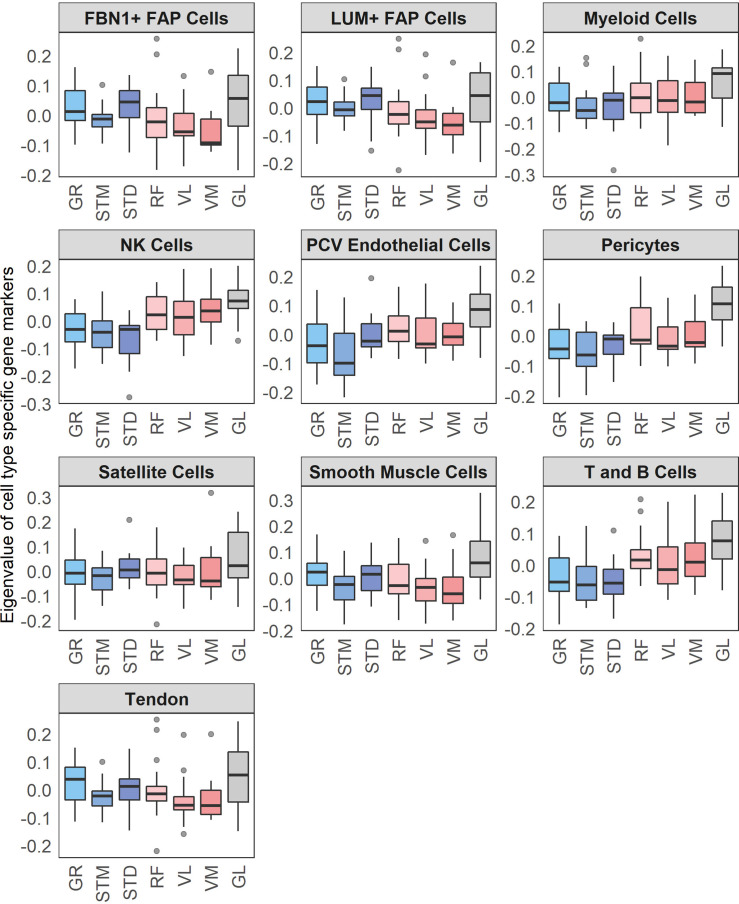
Figure 2—figure supplement 2. Cell types’ eigenvalues.

Figure 2—figure supplement 2.

Each boxplot shows the eigenvalues of a cell types across different muscles. The boxes reflect the median and interquartile range.