. 2023 Feb 1;12:e81436. doi: 10.7554/eLife.81436

Figure 2. Effects of active versus passive condition after pain relief and pain increase in each drug condition.

Means (bars) and 95% confidence intervals of means (error bars) for VAS pain intensity ratings (A, B, C) and behaviorally assessed pain perception (D, E, F; within-trial sensitization in pain perception in °C) for each drug session (placebo: n=28, levodopa: n=27, naltrexone: n=28). d indicates the standardized effect size after controlling for random effects and residual variance. ** p<0.01, *** p<0.001, for post-hoc comparisons of test versus control trials.

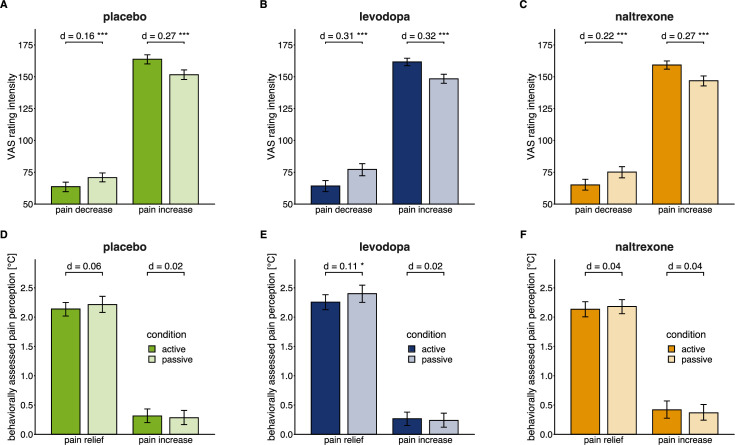
Figure 2.

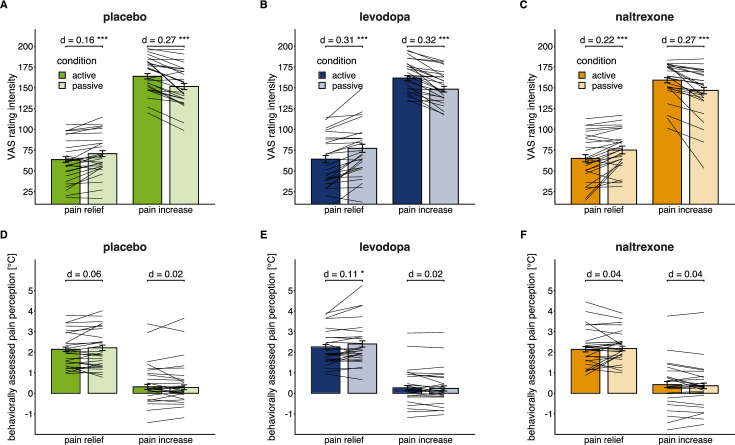
Figure 2—figure supplement 1. Individual level effects of active versus passive condition after pain relief and pain increase in each drug condition.

Figure 2—figure supplement 1.

Individual means superimposed on the group means (bars) and 95% confidence intervals of group means (error bars) for VAS pain intensity ratings (A, B, C) and behaviorally assessed pain perception (D, E, F; within-trial sensitization in pain perception in °C) for each drug session (placebo: n=28, levodopa: n=27, naltrexone: n=28). d indicates the standardized effect size after controlling for random effects and residual variance. ** p<0.01, *** p<0.001, for post-hoc comparisons of test versus control trials.