. 2023 Feb 1;12:e81436. doi: 10.7554/eLife.81436

Figure 3. Effects of drug manipulation on endogenous pain modulation.

Effects of drug manipulation on endogenous pain modulation assessed by VAS ratings of pain intensity (A) and behaviorally assessed pain perception (B) after winning and losing in the wheel of fortune game, respectively (placebo: n=28, levodopa: n=27, naltrexone: n=28). Bars show group level means and error bars show 95% confidence interval of the group level mean. d indicates the standardized effect-size after controlling for random effects and residual variance. While the temporal order of sessions did affect pain modulation (Figure 3—figure supplement 1), measures of pain sensitivity, that were not experimentally manipulated (Figure 3—figure supplement 2), and measures of mood (Figure 3—figure supplement 3) did not significantly differ between drug conditions. For individual effects of the drug manipulations on endogenous pain modulation see Figure 3—figure supplement 4.

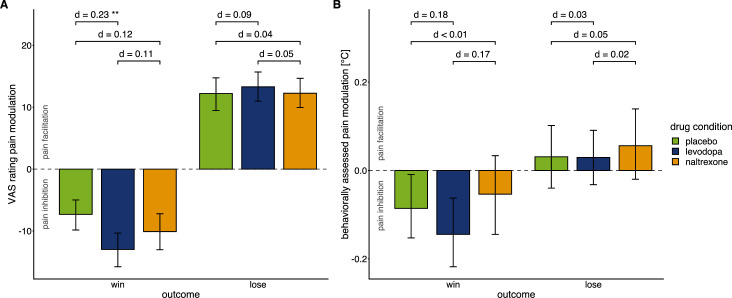
Figure 3.

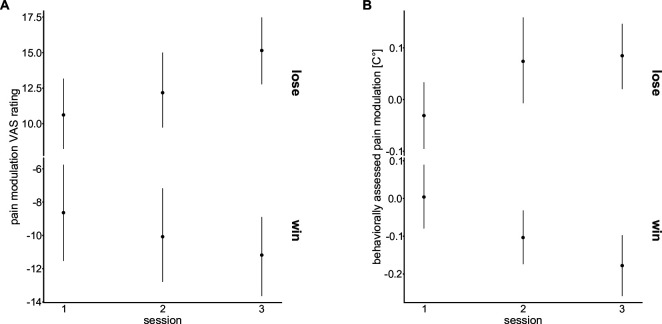
Figure 3—figure supplement 1. Effects of temporal order of sessions on endogenous modulation.

Figure 3—figure supplement 1.

Means (points) and 95% confidence intervals of the mean (error bars) for pain modulation in (A) VAS ratings and (B) behaviorally assessed pain modulation for each testing session.
Mixed-effects models testing whether the temporal order of the testing sessions, independent of the order of the application of the drugs, had an effect on pain modulation in win and lose trials of the wheel of fortune did not show a main effect of ‘session number’ (pain modulation VAS ratings: F(2, 1593.70)=1.28, p=0.279; behaviorally assessed pain modulation: F(2, 1599.84)=0.86, p=0.425) but point to a differential effect of temporal order for win and lose outcomes (interaction ‘outcome × session number’: pain modulation VAS ratings: F(2, 1593.77)=3.00, p=0.050; behaviorally assessed pain perception: F(2, 1597.27)=7.94, p<0.001). Hence, temporal order was included as an additional main effect when testing the effect of ‘drug’ on pain modulation.
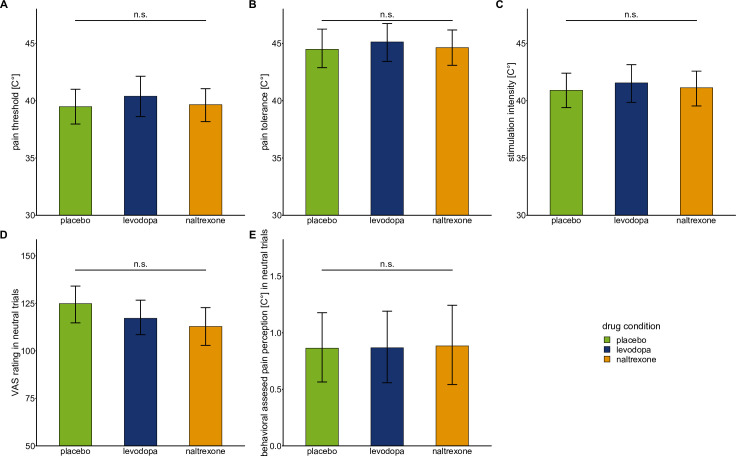
Figure 3—figure supplement 2. Baseline pain sensitivity and neutral condition of the wheel of fortune task.

Figure 3—figure supplement 2.

Bars show means and error bars 95% confidence intervals of the mean for (A) pain threshold, (B) pain tolerance, (C) stimulation intensity, (D) VAS ratings in neutral trials (in which participants did not play the game and the temperature stayed constant), and (E) behaviorally assessed pain perception in neutral trials for each drug condition.
Mixed-effects models using drug condition (placebo: n = 28, levodopa: n = 27, naltrexone: n = 28) to predict measures of baseline pain sensitivity showed no significant main effect for ‘drug’: pain threshold: F(2,53.21) = 0.64, p=0.529; pain tolerance: F(2,53.18) = 0.31, p = 0.736; stimulation intensity: F(2,53.2) = 0.30, p = 0.745. Mixed-effects models using drug condition to predict VAS ratings and behaviorally assessed pain perception in the neutral condition of the wheel of fortune task showed no significant main effect for ‘drug’: VAS ratings: F(2,53.31) = 2.12, p = 0.131; behaviorally assessed pain perception: F(2,53.13) = 0.01, p = 0.990.
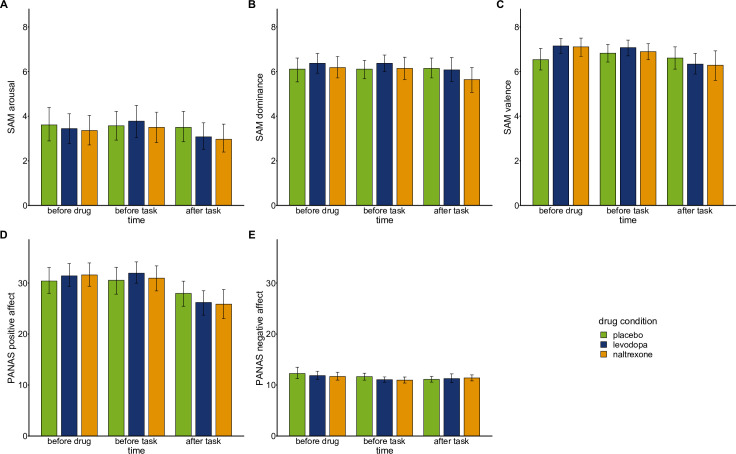
Figure 3—figure supplement 3. Mood ratings.

Figure 3—figure supplement 3.

Mood was assessed over the course of each experimental session before drug intake, before playing the wheel of fortune game, and after playing the game using computerized versions of the Self-Assessment Manikin (SAM; Bradley and Lang, 1994; Lang, 1980) and a German version (Krohne et al., 1996) of the Positive And Negative Affect Scale (PANAS; Watson et al., 1988).
Bars show means and error bars 95% confidence intervals of the mean for SAM subscales (A) arousal, (B) dominance, (C) valence, and PANAS subscales (D) positive affect, and (E) negative affect at each time point. To test whether drug conditions (placebo: n=28, levodopa: n=27, naltrexone: n=28) differentially affected mood we fit separate mixed-effects models predicting subscales of SAM and PANAS by ‘drug’, ‘time’, and their interaction. SAM ratings for arousal, dominance, and valence did not show any significant main effects of ‘drug’ (arousal: F(2,213.2)=1.56, p=0.214); dominance: F(2,213.29)=1.03, p=0.359; valence: F(2,213.41)=0.74, p=0.479) nor significant interactions for ‘drug x time’ (arousal: F(4,213.0)=0.69, p=0.599; dominance: F(4,213.00)=0.88, p=0.4771; valence: F(4,213.00)=2.28, p=0.062). Participants’ positive affect assed with the PANAS did not show a significant main effect of ‘drug’ (F(2,213.25=0.05, p=0.954) nor a significant interaction of ‘drug x time’ (F(2, 213.00)=1.60, p=0.176). Similarly, negative affect assessed with the PANAS did not show a significant main effect of ‘drug’ (F(2, 213.51)=0.93, p=0.376) nor a significant interaction of ‘drug x time’ (F(2, 213.00)=0.79, p=0.533).
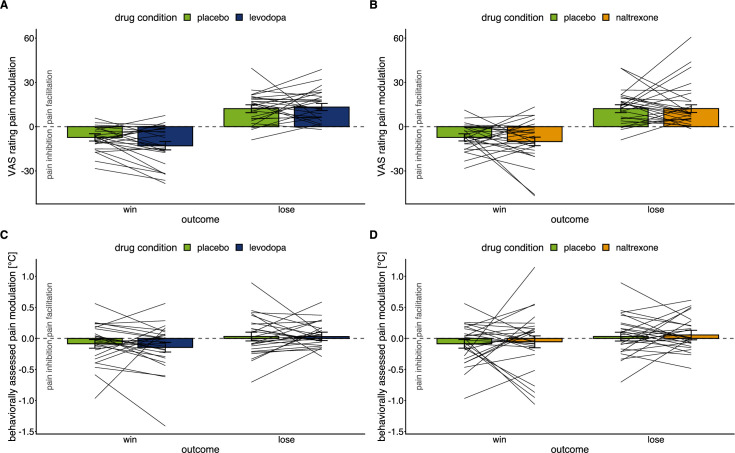
Figure 3—figure supplement 4. Individual level effects of drug manipulations on endogenous modulation.

Figure 3—figure supplement 4.

Effects of drug manipulation on endogenous pain modulation assessed by VAS ratings of pain intensity (A & B) and behaviorally assessed pain perception (C & D) after winning and losing in the wheel of fortune game, respectively (placebo: n=28, levodopa: n=27, naltrexone: n=28).
Bars show group level means and error bars show 95% confidence interval of the group level mean. Lines show individual means of the placebo condition and the respective drug condition.