. 2023 Feb 1;12:e81436. doi: 10.7554/eLife.81436

Figure 4. Proportion of choices of the color associated with a higher chance of winning pain relief.

Bars show group level means and error bars show 95% confidence interval of the group level mean (placebo: n=28, levodopa: n=27, naltrexone: n=28). OR indicates odds ratios as effect size of estimated effects between drugs. *p<0.05, ** p<0.01.
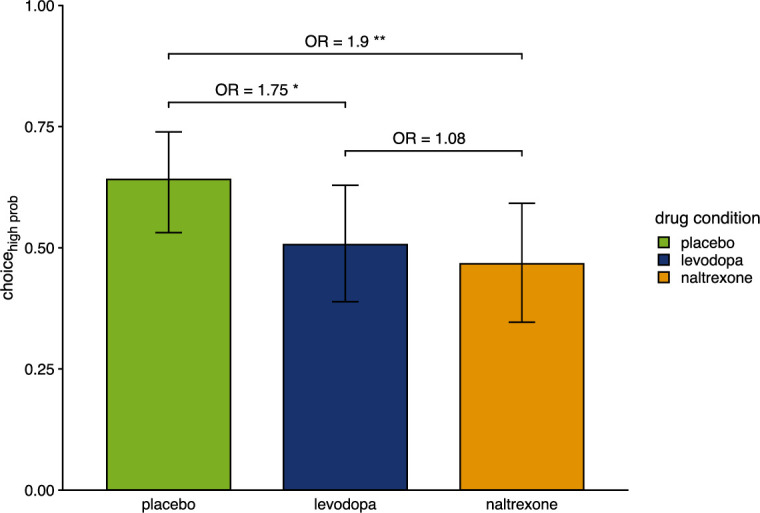
Figure 4.

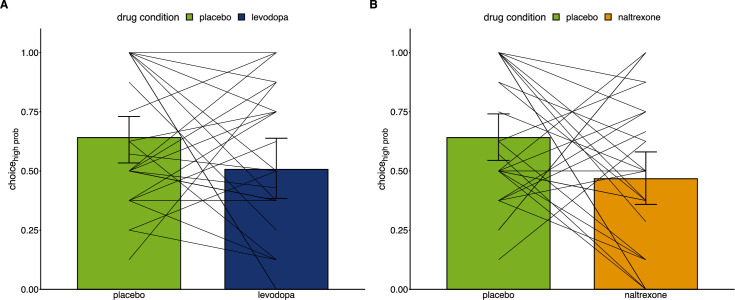
Figure 4—figure supplement 1. Individual level effects of drug manipulations on choice behavior.

Figure 4—figure supplement 1.

Proportion of choices of the color associated with a higher chance of winning pain relief (placebo: n=28, levodopa: n=27, naltrexone: n=28) comparing the placebo condition to the levodopa condition (A) and to the naltrexone condition (B).
Lines connect individual proportions of choices of the advantageous option between placebo and the respective drug condition.