. 2023 Feb 1;12:e81436. doi: 10.7554/eLife.81436

Figure 5. Posterior distributions of the proportion of choices in favor of choicehighprob.

Colored areas show 95% highest density interval (HDI95). Dashed lines indicate observed proportion of choices in favor of choicehighprob . Placebo (n=28): pchoicehighprob = 0.641, HDI95 = [0.614,0.655], posterior (p-value (pp)=0.320); levodopa (n=27): pchoicehighprob = 0.507, HDI95 = [0.491,0.530], p=0.679; naltrexone (n=28): pchoicehighprob = 0.467, HDI95 = [0.443,0.494], p=0.611. Figure 5—figure supplement 1 shows comparison of drug conditions for each parameter of winning model 4.

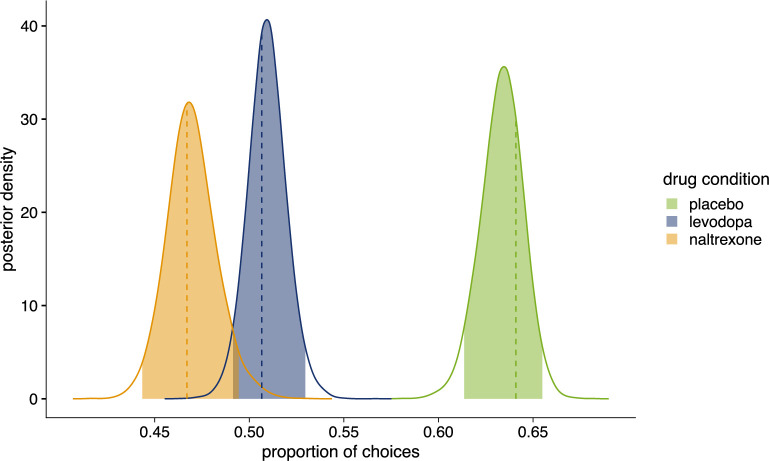
Figure 5.

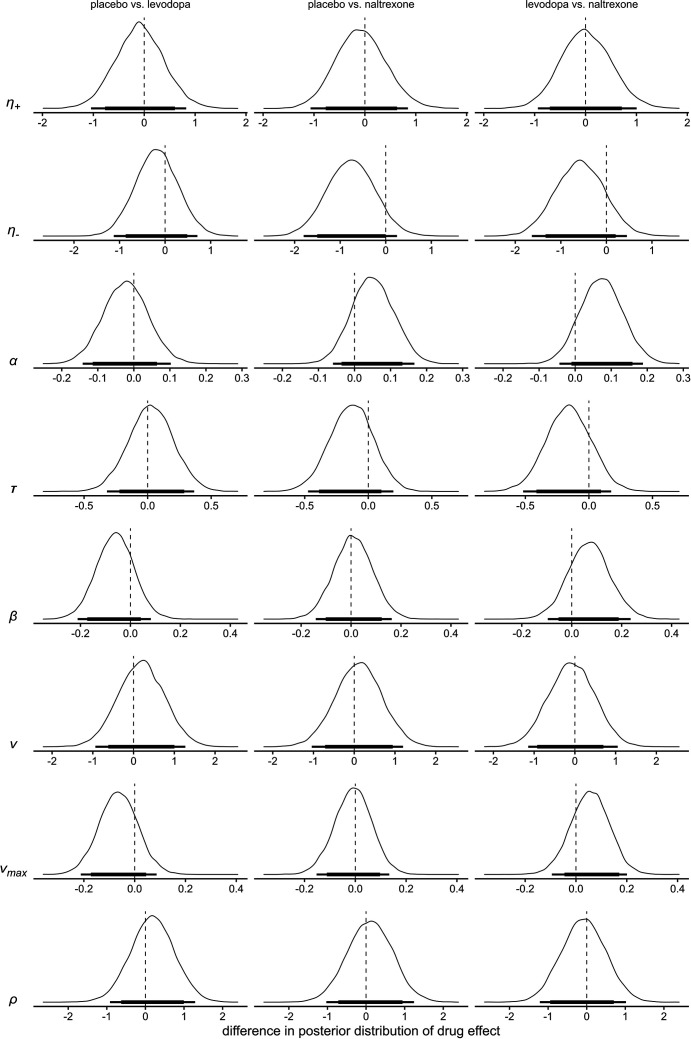
Figure 5—figure supplement 1. Differences of the posterior distributions of group level parameters for the main effect of drug in model 4.

Figure 5—figure supplement 1.

Thick black bars indicate the 85% HDI, thin bars indicate the 95% HDI. η+ : learning rate for positive prediction errors; η- : learning rate for negative prediction errors; α: boundary separation; τ: non-decision time; β: a-priori bias; ν: drift-rate scale factor; νmax : drift-rate boundary; ρ: outcome sensitivity.