
FIGURE 2.
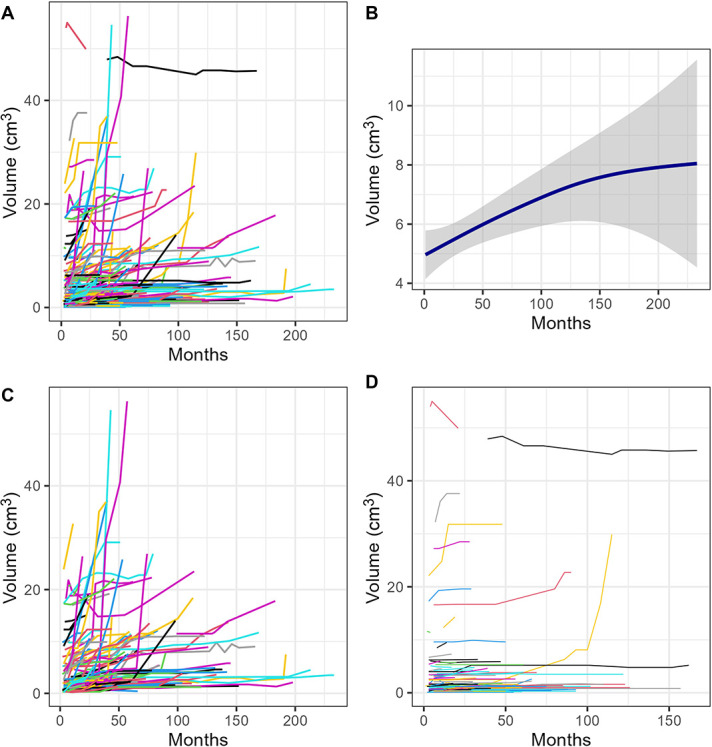
Volume-time growth plots demonstrating A, all volumetric growth of meningioma in the study, B, smooth conditional means plot demonstrating overall residual tumor growth (with shading representing 95% confidence intervals), C, meningiomas that progressed according to the RANO criteria, and D, meningiomas that did not progress according to the RANO criteria. RANO, Response Assessment in Neuro-Oncology