
FIGURE 5.
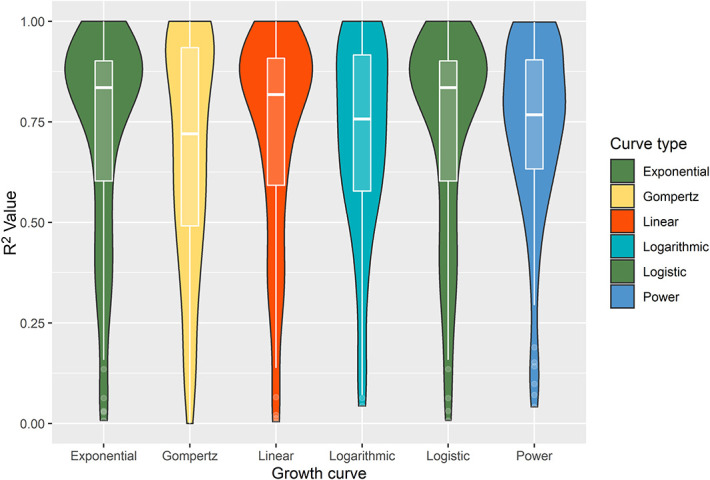
Violin plot (with internal boxplot) of the overall R2 values for all meningioma growth curves, stratified by the type of growth curve model. The wider the sections for each “violin,” the more meningioma R2 values are located around this. The exponential and logistic models (green) displayed the highest median R2 values overall.