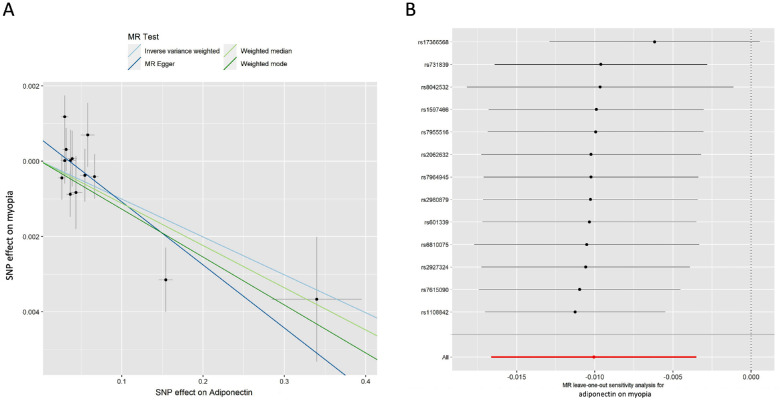
Figure 2.
MR analysis and leave-one-out analysis of the causal effect of adiponectin on myopia. (A) Scatterplots for MR analyses of the causal effect of adiponectin on myopia. The slope of each line corresponds to the estimated MR effect per method. (B) Leave-one-out analysis of the causal effect of adiponectin level on myopia. Each black point represents the IVW MR method applied to estimate the causal effect of adiponectin level on myopia, excluding that particular variant from the analysis. The red point represents the IVW estimate using all SNPs.

