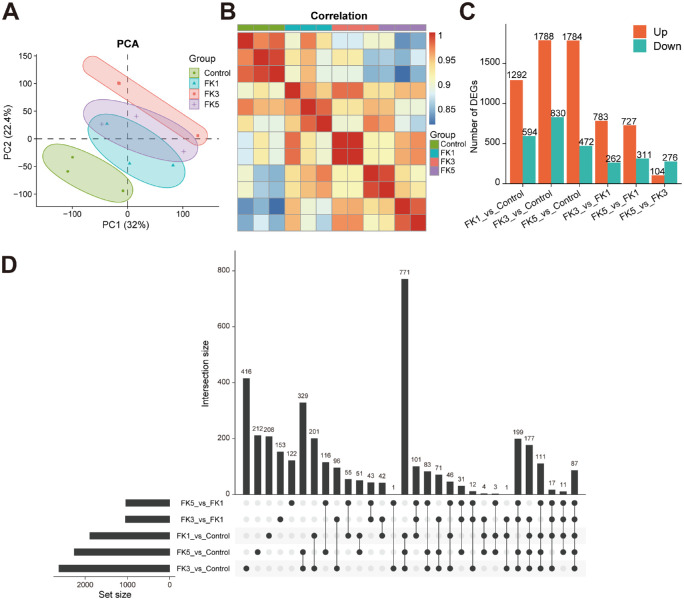
Figure 2.
Comparative transcriptome analysis reveals the expression changes of the infected corneas in the fungal keratitis mouse model. (A) Principal component analysis of gene expression datasets in each group. (B) Spearman correlation analysis of the transcriptome sequencing samples. (C) The number of differentially expressed genes (DEGs) in each comparison group. (D) UpSet plot showing the interaction of DEGs in each comparison group. PCA, principal component analysis; DEGs, differentially expressed genes.

