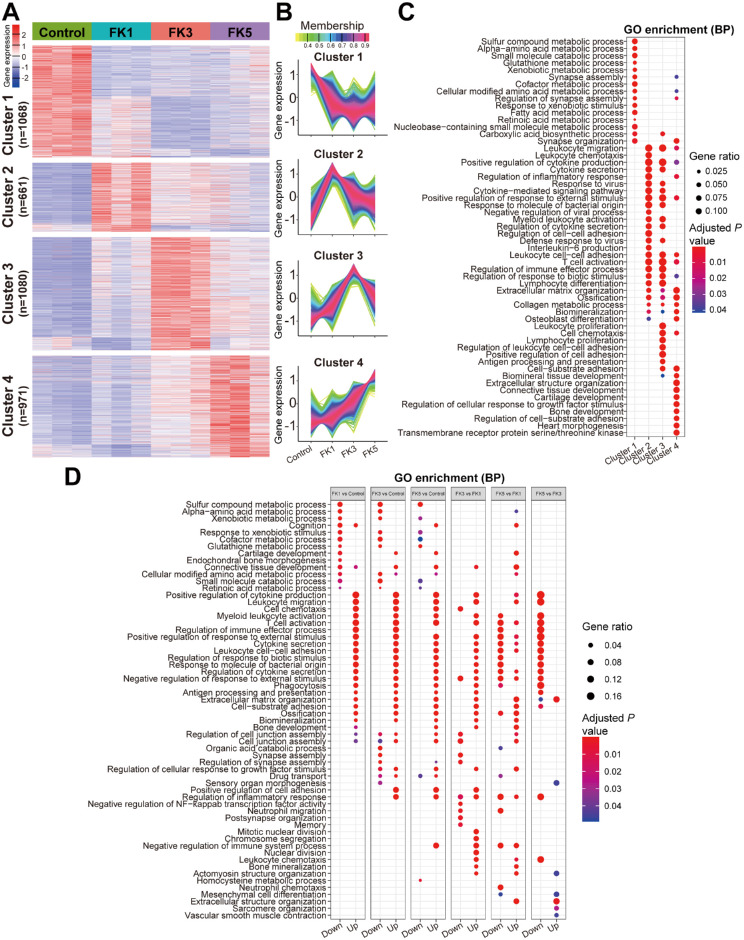
Figure 3.
Functional enrichment analysis of DEGs in the fungal keratitis mouse model at different time points. (A) Genewise clustering heatmap showing DEGs in each comparison group. (B) Four clusters were divided according to gene expression patterns in each group. The number of DEGs in clusters 1, 2, 3, and 4 were 1068, 661,1080, and 971, respectively. (C) GO enrichment analysis of the DEGs in the four clusters. (D) GO enrichment analysis of the significant upregulated or downregulated DEGs between the indicated groups. GO, gene ontology.

