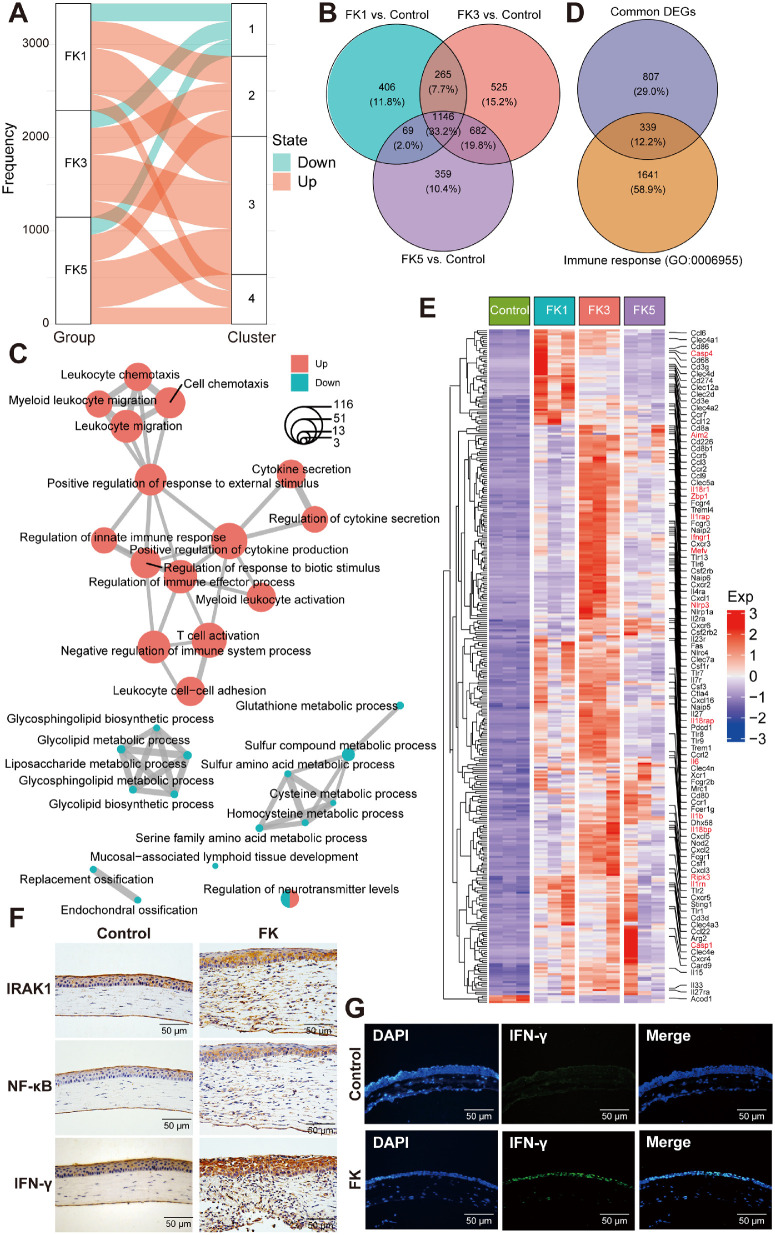
Figure 5.
Shared innate immune responses among different FK groups. (A) Alluvial plots showing the distribution of upregulated and downregulated DEGs across different clusters. (B) Venn diagram of DEGs among the three FK comparison groups. (C) Enrichmap plot showing the interaction networks between enriched biological processes analyzed by the clusterProfiler package. The color of the dots represented the state of DEGs being upregulated or downregulated, and the size of the dot indicated the number of DEGs enriched in the corresponding GO terms. (D) Venn diagram showing the total number of shared DEGs between common DEGs within three FK groups and genes in the GO term “immune response” (GO: 0006955). (E) Heatmap displaying expression patterns of the 339 shared immune-related DEGs among the four groups. (F) Immunohistochemistry staining of several representative immune markers (IRAK1, NF-κB, and IFN-γ) in mouse corneas with or without fungal infection. (G) Representative immunofluorescence images showing the increased expression levels of IFN-γ in corneal epithelial cells after A. fumigatus infection. IRAK1, interleukin-1 receptor-associated kinase 1; NF-κB, nuclear factor-κB; IFN-γ, interferon-gamma.

