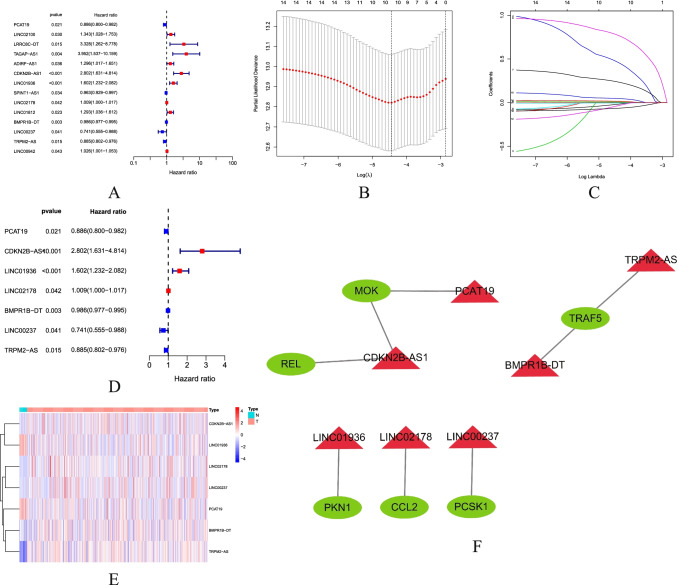
Fig. 2.
Identification of prognostic necroptosis-related LncRNAs. A Univariate cox regression forest plot shows that 14 prognostic-related NRLncRNAs are initially screened. Red indicates that the Hazard ratio (HR) index is greater than 0, blue indicates that the HR index is less than 0; B, C Lasso-Cox regression analysis shows that 10 RNLncRNAs are good candidates for constructing prognostic characteristics; D multivariate cox regression forest plot shows that PCAT19, CDKN2B-AS1, LINC01936, LINC02178, BMPR1B-DT, LINC00237, and TRPM2-AS were prognosis-associated NRLncRNAs and were involved in forming the prognostic model. Red indicates that the HR index is greater than 0, blue indicates that the HR index is less than 0; E heatmap of prognostic-related NRlncRNAs. Blue represents low expression of LncRNA, red represents high expression of LncRNA; F mRNA-LncRNA co-expression network of prognosis-associated NRlncRNAs and necroptosis-related genes. Green molecules indicate mRNA, red molecules indicate LncRNA

