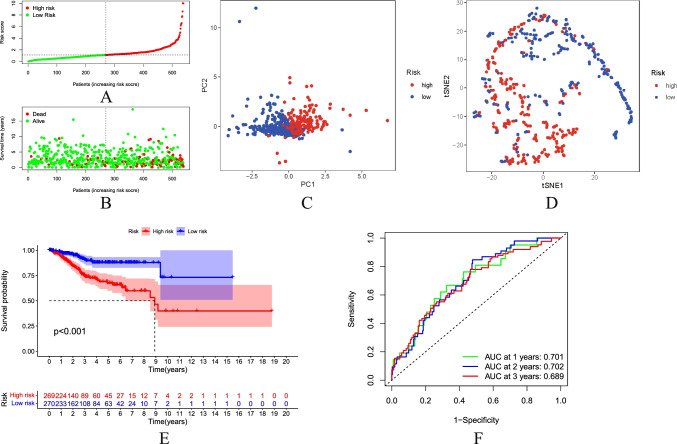
Fig. 3.
Prognostic analysis of the characteristic model of necroptosis-related LncRNAs. A Distribution map of patients in high-risk group and low-risk groups. B Patient’s survival status chart. C Principal component analysis (PCA) plot. D t-SNE (t-distributed stochastic neighbor embedding) plot. E Kaplan–Meier survival curve analysis showed significant differences in OS between low- and high-risk score groups. F The AUC of the ROC curve validated the prognostic accuracy of the risk score

