Fig. 1.
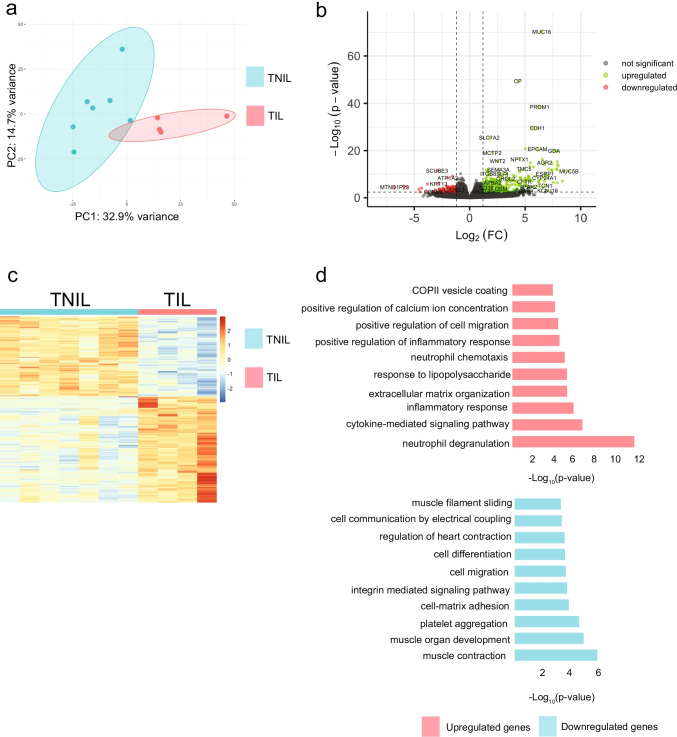
Distinct transcriptomes of TIL and TNIL myometrial tissues. a PCA of TNIL (blue) and TIL (pink) samples show distinct clustering. b Volcano plot showing all detected transcripts with significant genes (FDR < 0.05) shown as upregulated (green) or downregulated (red) in TIL generated by DESeq2 analysis. c Heatmap of significant differentially expressed genes in TNIL (blue) and TIL (pink). d Gene ontology of genes upregulated (pink) and downregulated (blue) in labor

