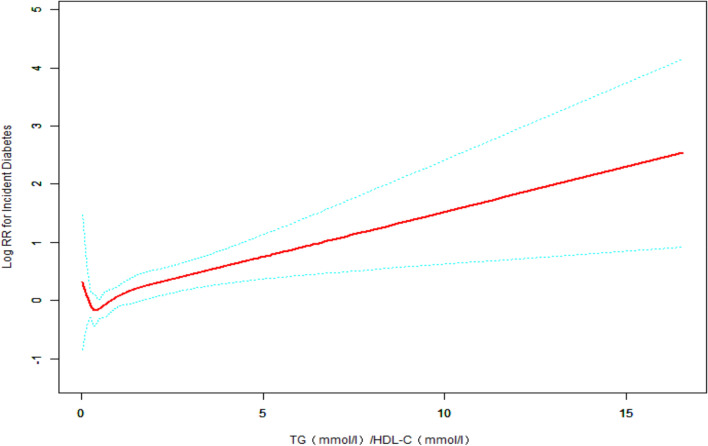
Figure 1.
GAM and smoothed curve fitting were used to investigate the relationship between TG/HDL-C ratio and the incidence of T2DM. The red solid line indicates the estimated risk of developing T2DM. The green dashed line indicates the 95% confidence interval of the fit. After adjusting for gender, age, exercise habits, body mass index, fatty liver, total cholesterol, hemoglobinA1c, smoking status, alcohol consumption, fasting plasma glucose, a J-shaped relationship was detected between TG/HDL-C ratio and the incidence of T2DM, with the risk of developing T2DM decreasing with increasing TG/HDL-C on the left side of the inflection point and the opposite relationship observed on the right side of the inflection point. Association between TG/HDL-C and T2DM in the Japanese population: J-shaped association between TG/HDL-C and T2DM. The solid red line indicates the smoothed curve fit between the variables. The green dashed line indicates the 95% confidence interval of the fit. Adjusted for gender, age, exercise habits, body mass index, fatty liver, total cholesterol, hemoglobinA1c, smoking status, alcohol consumption, fasting plasma glucose.

