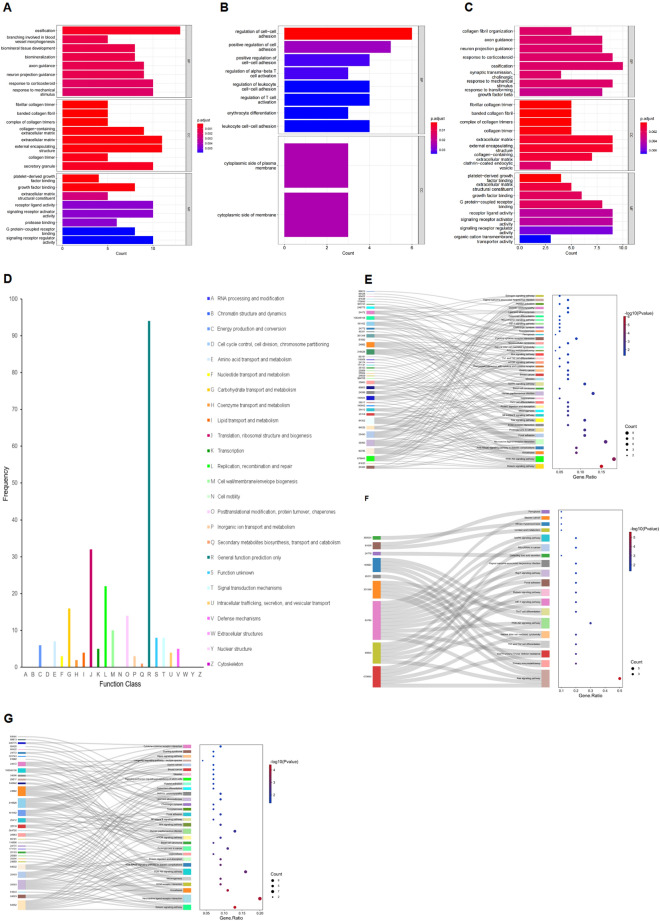
Figure 2.
(A) Gene ontology (GO) annotation analysis of 112 differentially expressed genes (DEGs) for the control-24 h and acute hypobaric hypoxia (AHH)-24 h groups. The top eight categories with the smallest p values for each classification were screened for GO annotations. BP, biological process; CC, cellular component; MF, molecular function. The bar color in the graph represents the p value distributed from blue to red; the closer to red, the smaller the p-value, and vice versa. (B) DEGs upregulated in the AHH-24 h group compared with those in the control-24 h group subjected to GO annotation analysis. (C) DEGs downregulated in the AHH-24 h group compared with those in the control-24 h group analyzed by GO annotation. (D) Clusters of orthologous gene (COG) classification analysis of 112 DEGs. The vertical axis indicates the frequency of DEGs in specific functional clusters, and the horizontal axis indicates the functional class. (E) Kyoto Encyclopedia of Genes and Genomes (KEGG) transcript classification analysis of 112 DEGs in the control-24 h and AHH-24 h groups. The left and right-colored bars represent the two groups of DEGs and the KEGG pathways, respectively. Lines connecting the KEGG pathway show the enrichment of the two sets of DEGs. The horizontal axis of the bubble plot indicates the gene ratio (the ratio of the number of DEGs enriched in the corresponding pathway to the number of all DEGs entered for enrichment analysis). The vertical axis indicates the KEGG pathway term, and the bubble size represents the number of differentially annotated genes in a term, with larger bubbles indicating more genes. The color represents the enrichment significance p value, with a higher intensity of the red color representing a smaller value (indicating stronger significance). (F) KEGG analysis of DEGs upregulated in the AHH-24 h group compared with those in the control-24 h group. KEGG transcripts for taxonomic analysis. (G) KEGG transcript classification analysis of the DEGs downregulated in the AHH-24 h group compared with those in the control-24 h group.

