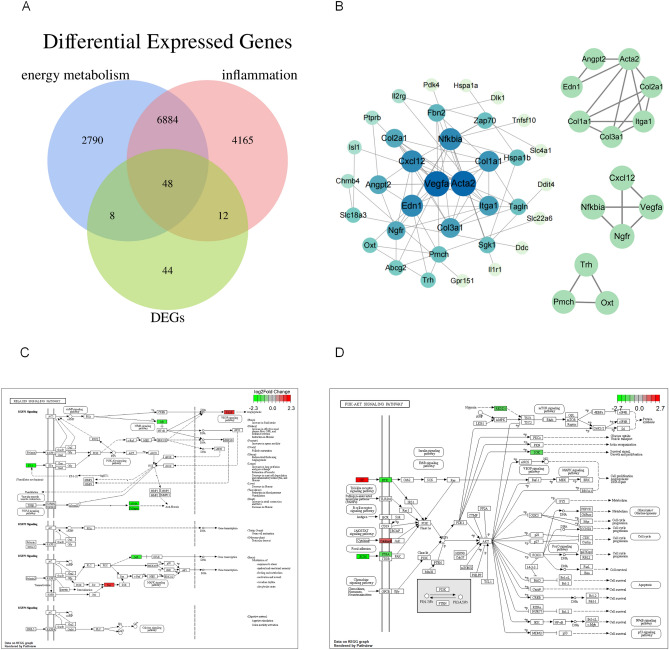
Figure 3.
(A) Venn diagram of common differentially expressed genes (DEGs) between groups. The three circles represent energy metabolism-associated genes, inflammation-associated genes, and DEGs. The intersecting regions of the circles indicate the intersecting genes of different groups. (B) Proteins interacting with inflammation- and energy metabolism-associated genes. The protein–protein interaction network of DEGs was visualized using Cytoscape (version 3.9.1) according to its topological properties. The higher the color intensity and the lower the distance to the center, the more the number of genes it interacted with in the network. The hub sub-networks were screened by the MCODE plug-in. (C) Relaxin signaling pathway (www.kegg.jp/entry/map04926). Red and green boxes represent DEGs that were significantly up or downregulated in this pathway, respectively. (D) PI3K-Akt signaling pathway (www.kegg.jp/entry/map04151). Red and green boxes represent DEGs that were significantly up or downregulated in this pathway, respectively.

