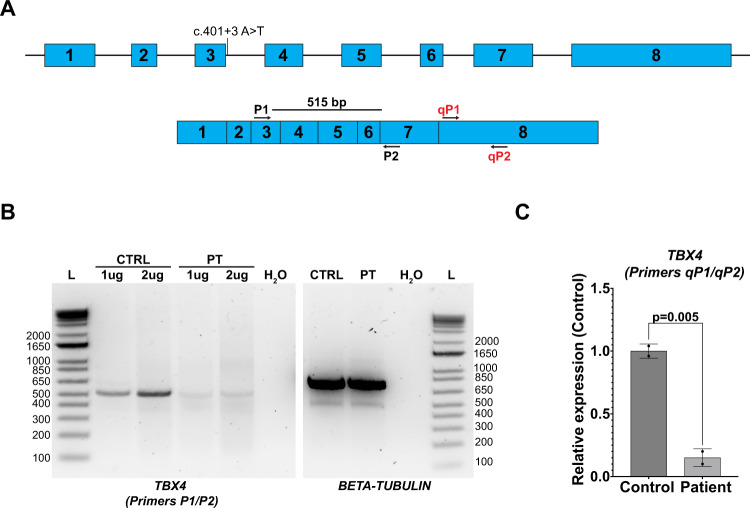
Fig. 2. Reduced TBX4 expression in proband-derived lymphoblastoid cell lines.
A Schematic of TBX4 genomic structure (top) and spliced cDNA (bottom). Primer pairs used in B and C are depicted. B PCR analysis of TBX4 transcript using primers P1 and P2 on cDNA derived from 1ug or 2ug of RNA isolated from control (CTRL) or proband-derived (PT) lymphoblastoid cell lines (left panel). PCR analysis of β-tubulin transcript was used as a control (right panel). H2O denotes water control and L denotes the 1 Kb ladder. C qPCR analysis of TBX4 expression using primers qP1 and qP2 on control and proband-derived lymphoblastoid cell lines. Data is normalized to GAPDH expression and is expressed relative to control sample expression. Two biologic replicates included per experiment that were repeated N = 2. P-value determined by Student’s 2-tailed t-test. Error bars reflect standard deviation.

