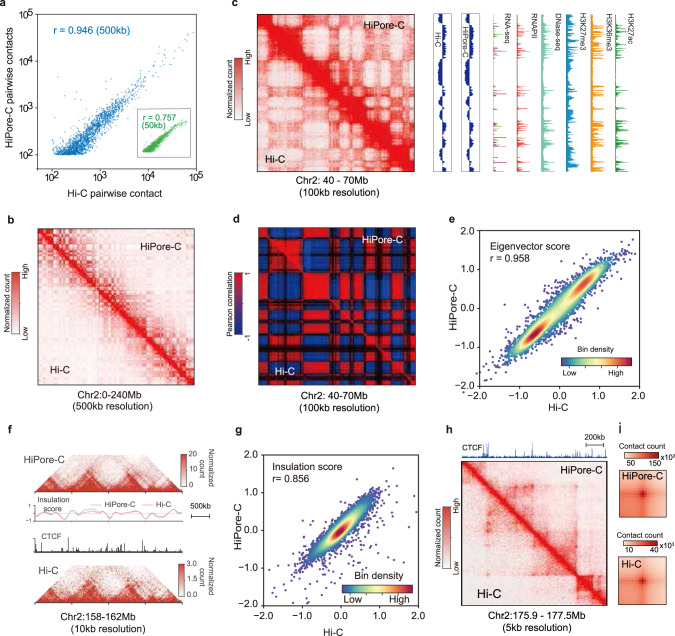
Fig. 2. HiPore-C faithfully reproduces canonical 3D genome structures.
a Pearson’s correlation of pairwise contacts between HiPore-C and Hi-C (Pairwise contact count > = 50; blue, 500 kb resolution, n = 13,613,408, P = 0; green, 50 kb resolution, n = 12,498,125, P = 0). b Comparison of contact maps between HiPore-C and Hi-C (upper right, HiPore-C; bottom left, Hi-C; 500 kb resolution). c An exemplary region showing compartment comparison between HiPore-C and Hi-C (100 kb resolution, tracks of eigenvector scores, RNA-seq, DNase-Seq, and ChIP-seq of RNA polymerase II (RNAPII), H3K27ac, H3K36me3, and H3K27me3 are shown on the right.). d An exemplary region showing a Pearson’s correlation comparison between HiPore-C and Hi-C (100 kb resolution). e Correlation of eigenvector scores between HiPore-C and Hi-C (100 kb resolution bins, Pearson’s correlation coefficient r = 0.958, n = 27,935, P = 0). f An exemplary region showing a TAD comparison between HiPore-C and Hi-C (10 kb resolution; insulation scores and CTCF track are shown in the middle). g Correlation of insulation scores between HiPore-C and Hi-C (50 kb resolution bins, Pearson’s correlation coefficient r = 0.856, n = 56,244, P = 0). h An exemplary region showing a loop comparison between HiPore-C and Hi-C (10 kb resolution, CTCF track is shown at the top). i Comparison of the aggregate peaks between HiPore-C and Hi-C (10 kb resolution; peaks+/−100 kb).

