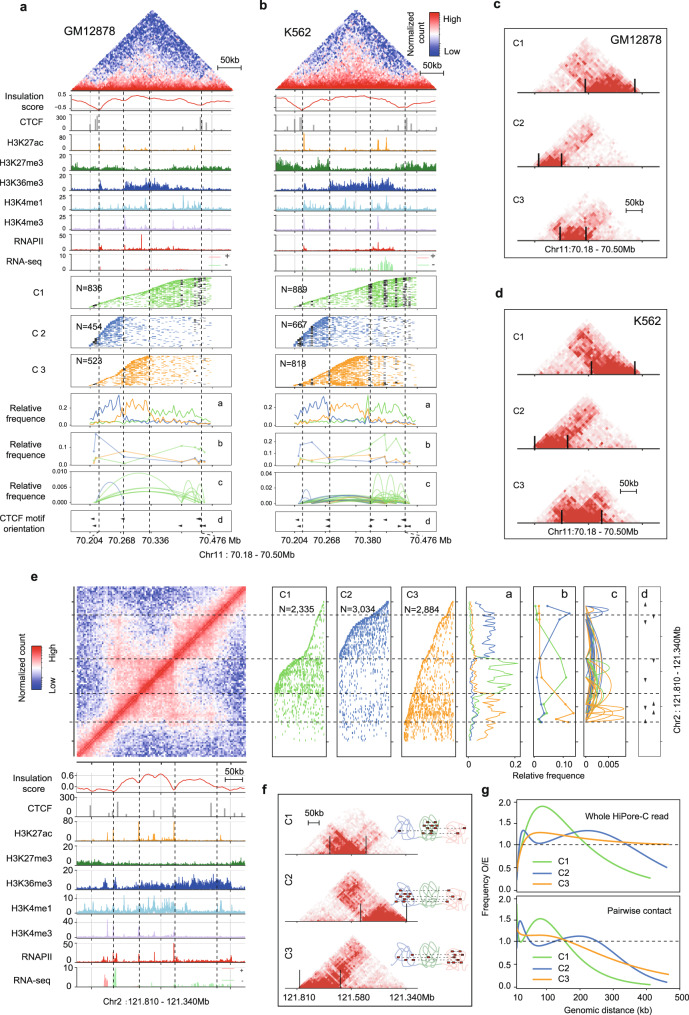
Fig. 5. Diversity and cell type-specificity of single-allele topology clusters underlie the formation of TADs.
Clustering of HiPore-C reads covering an exemplary TAD in GM12878 (a) and K562 (b) at 5 kb resolution (bin). The top panels are the pairwise contact heatmaps and additional tracks, as indicated. Middle panels are hierarchical clusters of multiway contact reads: C1, green; C2, blue; C3, orange. Reads are arranged according to the genomic coordinates of the 5′ fragments in reads. Bins containing CTCF peaks (ENCODE data) are shown in black. The relative frequencies of bins (a) and bins containing CTCF (b) are shown in the line plot panel. The relative frequency of pairwise contact between bins containing CTCF peaks (c) is shown in the arc-line panel. The orientation of CTCF motifs (d) that are covered by fragments in HiPore-C reads is shown in the bottom panel. c, d.Heatmaps of the three HiPore-C read clusters in panels a and b. e, Clustering of HiPore-C reads covering a hierarchical TAD in GM12878 (5% of reads from each cluster were randomly selected and visualized in panels C1-C3). f, Heatmaps of the three HiPore-C read clusters in panel e. g. The normalized observed/expected contact frequency against genomic distance for three clusters of reads in the hierarchical TAD shown in panel e. The top panel shows the genomic distances covered by whole HiPore-C reads. The bottom panel shows the genomic distances covered by virtual pairwise contacts in HiPore-C reads.

