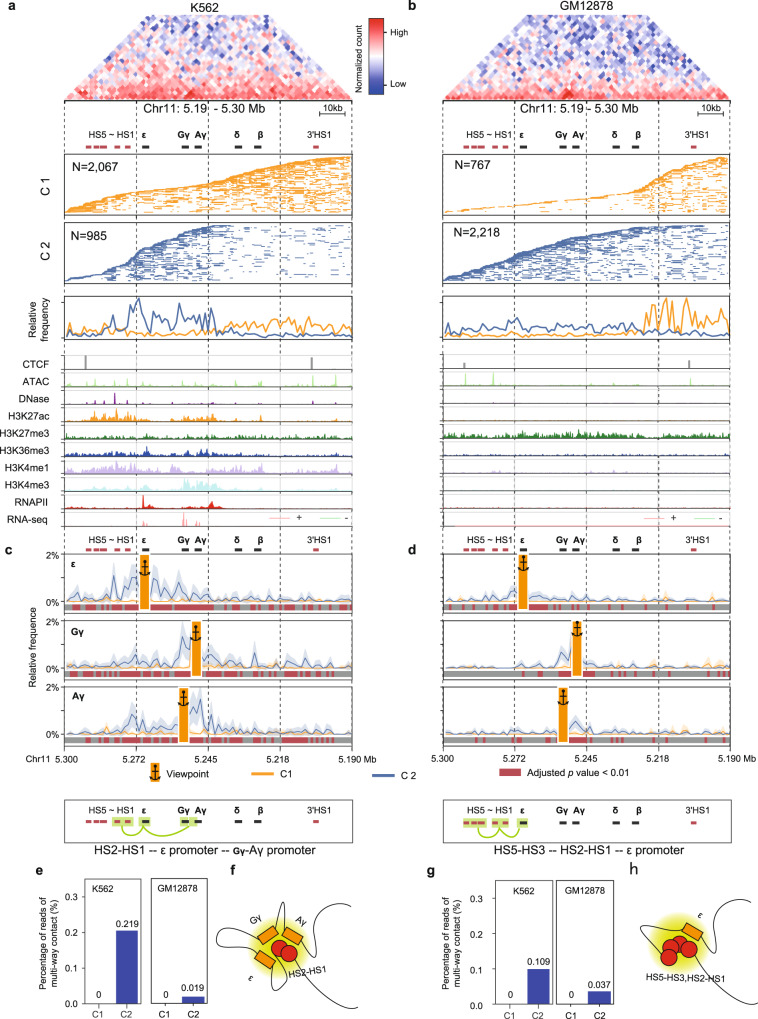
Fig. 6. HiPore-C reveals a cell type-specific enhancer hub at the β-globin locus.
Clustering of HiPore-C reads covering the human β-globin locus in K562 (a) and GM12878 (b) cells (The HiPore-C reads were binned at 1 kb resolution. Only reads containing three or more fragments in the region of Chr11:5.19-5.30 Mb were used to perform clustering. Fifty percent of the reads from each cluster were randomly selected and visualized in multi-contact read panels). Multiway contact analysis anchored at human ε- and Gγ-/Aγ-globin gene promoters in K562 (c) and GM12878 (d) cell lines. Viewpoints are shown as anchors. Reads from each cluster were randomly sampled 100 times to generate subsample sets. The relative appearance frequency of reads with viewpoints was calculated. Lines with shading represent the mean±sd of the bin relative appearance frequency in the subsample sets. The statistical significance of the relative appearance frequency of bins was calculated by comparing the two clusters using a two-sided Welch’s test with Bonferroni correction and is depicted with gray and dark red bars (gray, non-significant, adjusted P > = 0.01; red, significant, adjusted P < 0.01). e Multiway contacts at the human β-globin gene locus formed by simultaneous interactions of human ε- and Gγ-/Aγ-globin genes and two hypersensitive enhancer sites (HS2 and HS1). f A graphic showing the multiway contacts formed by simultaneous interactions of three human ε- and Gγ-/Aγ-globin genes and two hypersensitive enhancer sites (HS2 and HS1). g Multiway contacts at the human β-globin gene locus formed by simultaneous interactions of the human ε-globin gene and hypersensitive sites (HS2, HS1, and HS5-HS3) in the locus control region. h A graphic showing the multiway contacts in g.

