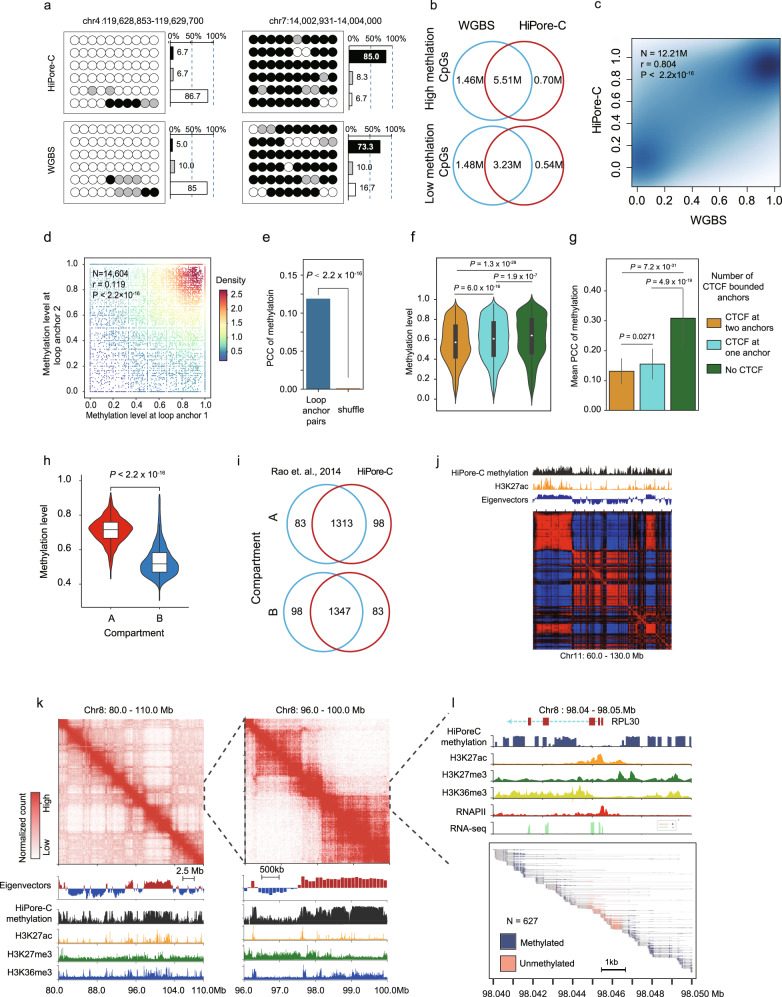
Fig. 7. HiPore-C captures DNA methylation and chromatin topology simultaneously.
a CpG methylation captured by HiPore-C and WGBS. (Black, highly methylated, average methylation ratio > = 0.6; gray, medianly methylated, average methylation ratio 0.4 − 0.6; white, lowly methylated, average methylation ratio < = 0.4). Bar plots show the distribution of CpGs with different methylation levels. b Overlap of the highly and lowly methylated CpG between the HiPore-C and WGBS datasets. c, Pearson’s correlation between HiPore-C and WGBS datasets on CpG methylation levels (with 5x coverage). d, e Pearson’s correlation coefficient (PCC) values of CpG methylation levels between anchors of chromatin loops14 (25 kb resolution bin). Only reads (n = 14,604) containing three or more CpGs on both anchor fragment were used in calculation. In e, paired anchor fragments in reads were shuffled (n = 14,604, shuffled anchor pairs) to calculate the expected background PCCs. Comparison of the PCCs of the expected background and the observed is shown in d. Statistical significance was calculated using Finsher’s z (1925) in cocor package tool. Distribution of anchor methylation level (f) and comparison of the PCC values between paired anchors (g) of three loop types. Loops with CTCF at two anchors (n = 4858); Loops with CTCT at one anchor, (n = 3432); Loops without CTCF (n = 1140). Statistical significance was calculated by the Kruskal-Wallis test, followed by Dunnett’s t-test. In f and h, the center line/ dot, median; boxes, first and third quartiles; whiskers, 5th and 95th percentiles. In g, Data are shown as the mean ± sd. h Distribution of methylation level in the A (n = 1396) and B (n = 1445) compartments. Statistical significance was calculated by two-sided Student’s t-test. Data are shown as in f. i Venn diagrams show the overlap between A, and between B compartments that were identified by Rao et al.14 and by using the HiPore-C captured CpG methylation, respectively. j Chromatin compartments and methylation profile at Chr11:60Mb-130.0 Mb. The H3K27ac track was plotted using ENCODE H3K27ac datasets. k, I, Contact heatmaps (500 kb and 50 kb resolutions) and methylation profiles at Chr8:80.0Mb-110.0 Mb. Dashed lines show the amplified regions from the left panels. In panel l, methylated and unmethylated regions detected by HiPoreC in local single-allele reads are shown in the bottom frame. The ChIP-seq and RNA-seq tracks were plotted using data from ENCODE database.

